
ChartViews AI Blog
Trading insights, market analysis, and educational content to sharpen your edge.
Analyze a chart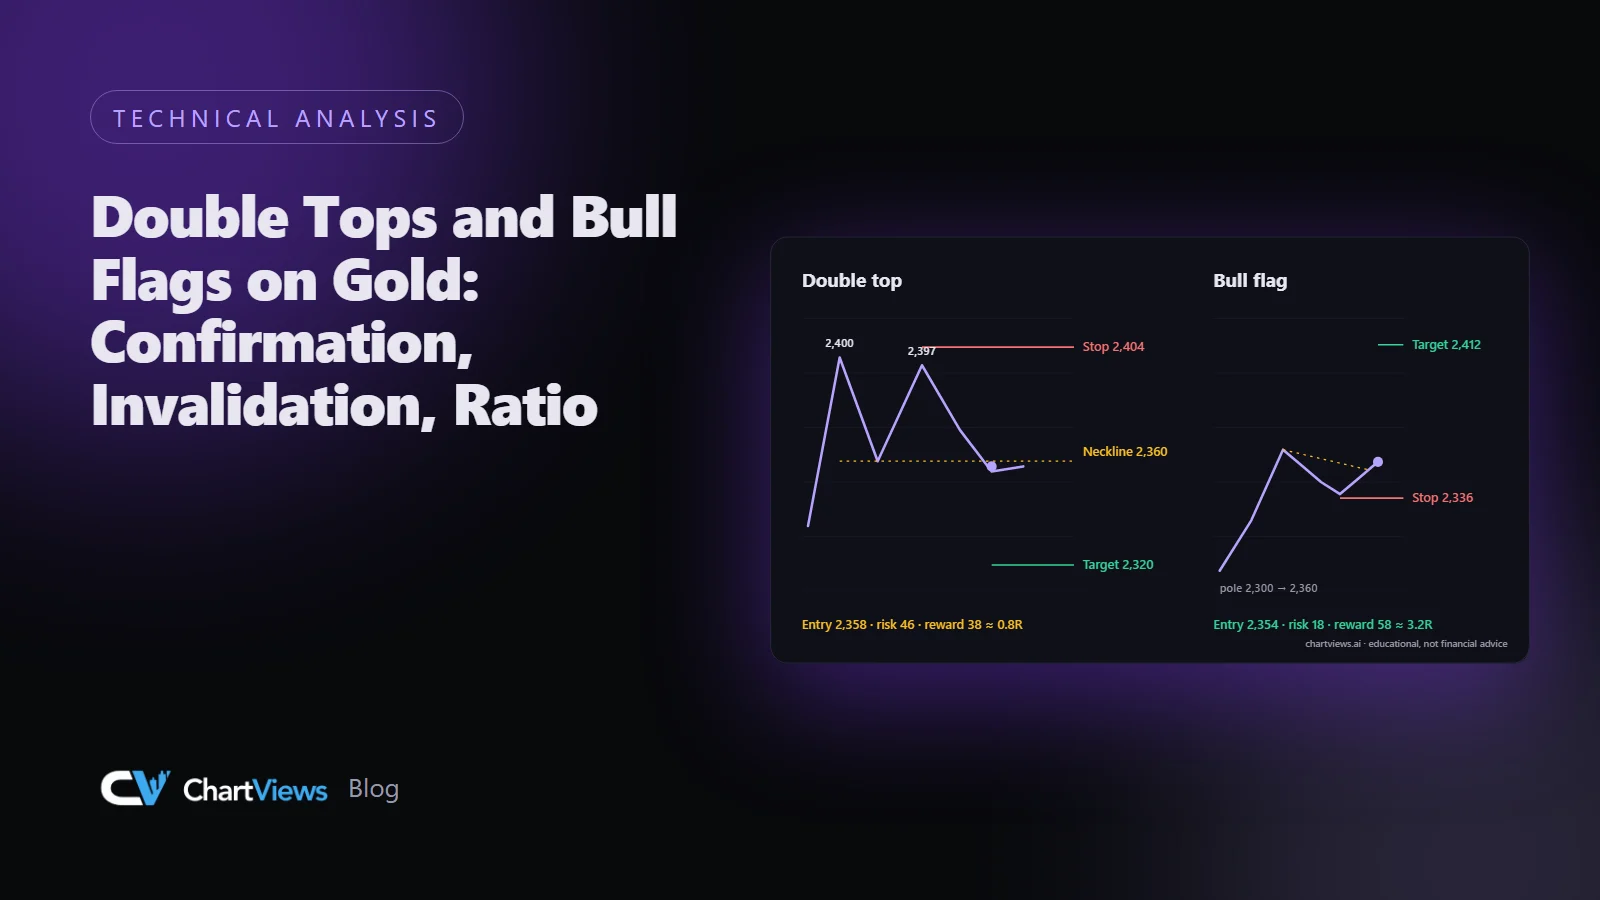 LatestDouble Tops and Bull Flags on Gold: Confirmation, Invalidation, RatioRead a double top and a bull flag on gold with hypothetical prices: what confirms them, where they fail and whether the ratio works.November 13, 2026 · 6 min read



All articles (100)
- Double Tops and Bull Flags on Gold: Confirmation, Invalidation, Ratio
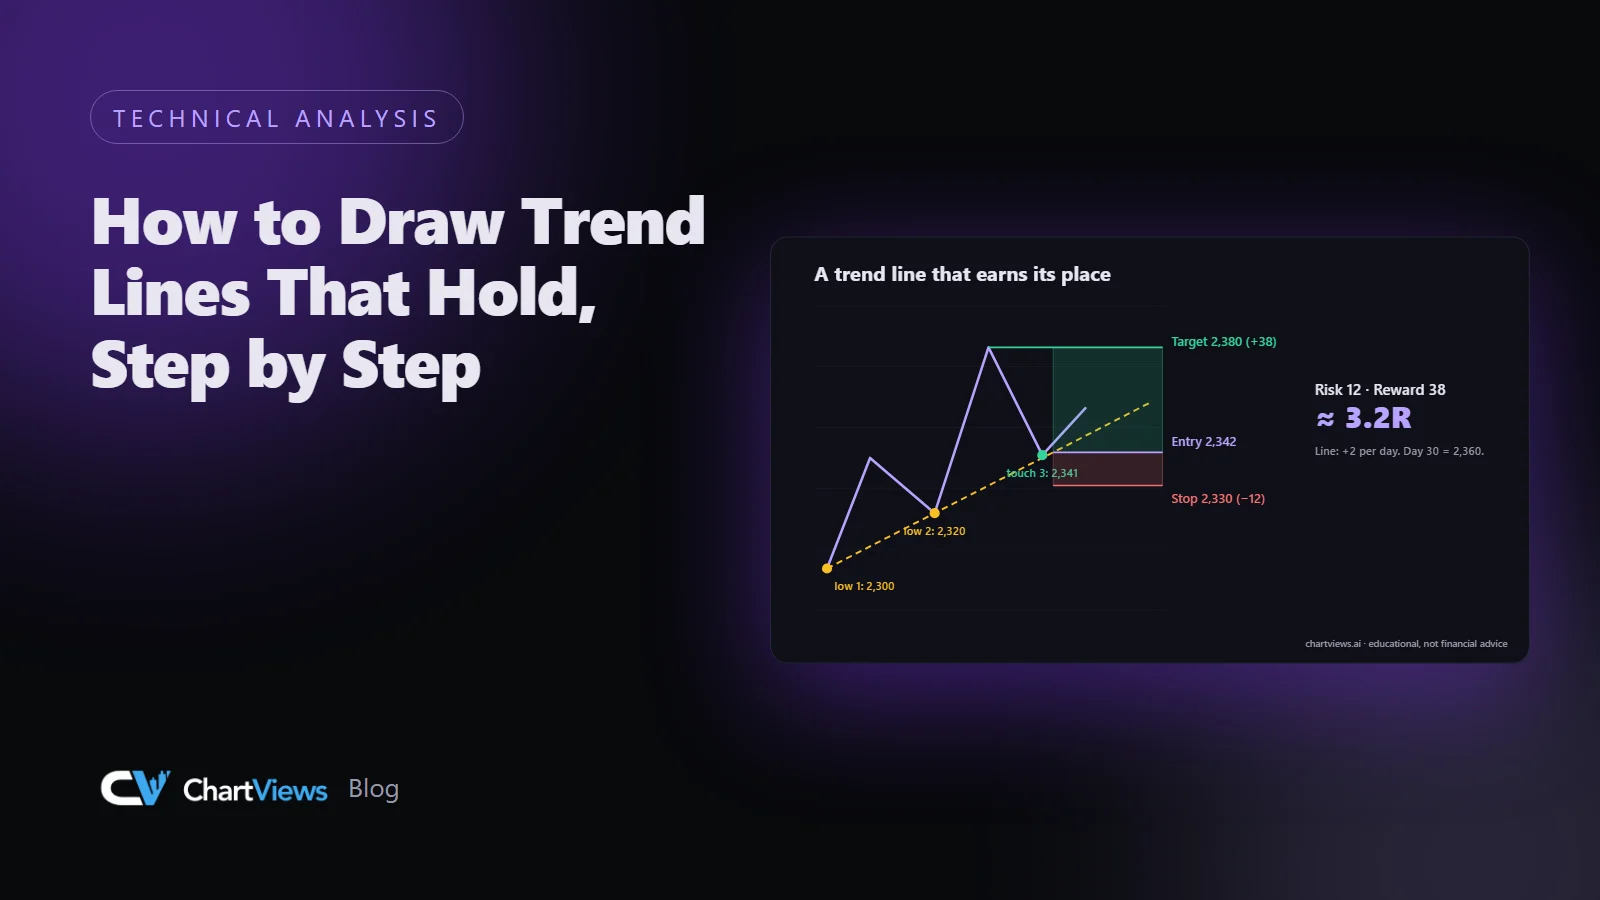
- How to Draw Trend Lines That Hold, Step by Step
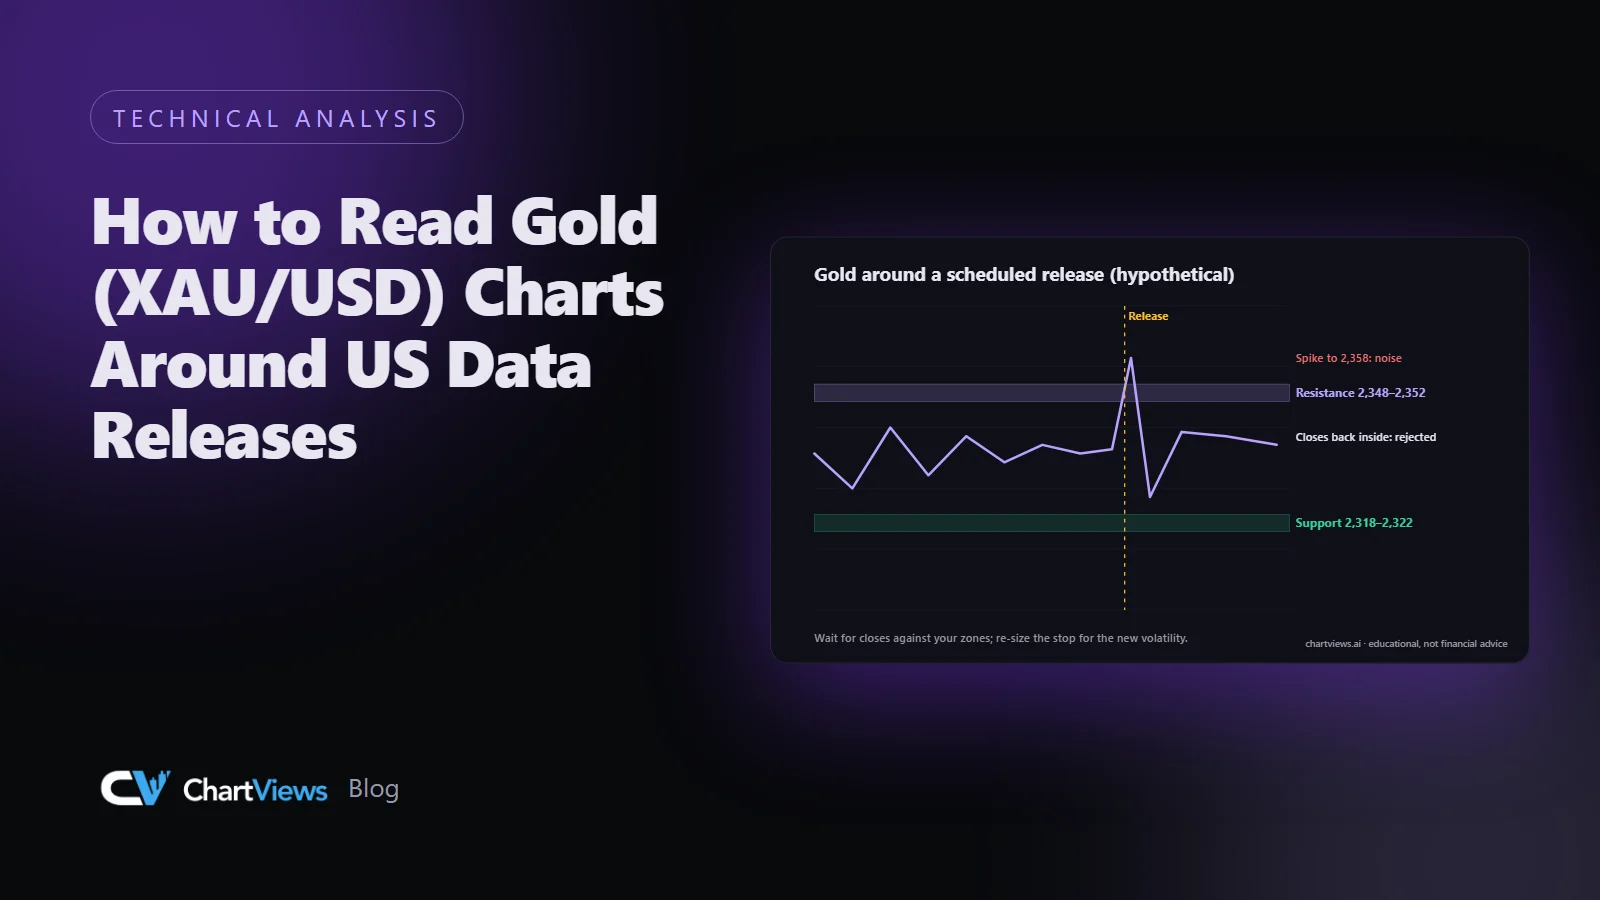
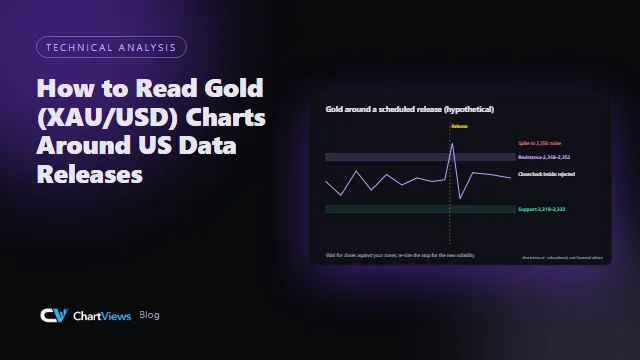
- How to Read Gold (XAU/USD) Charts Around US Data Releases
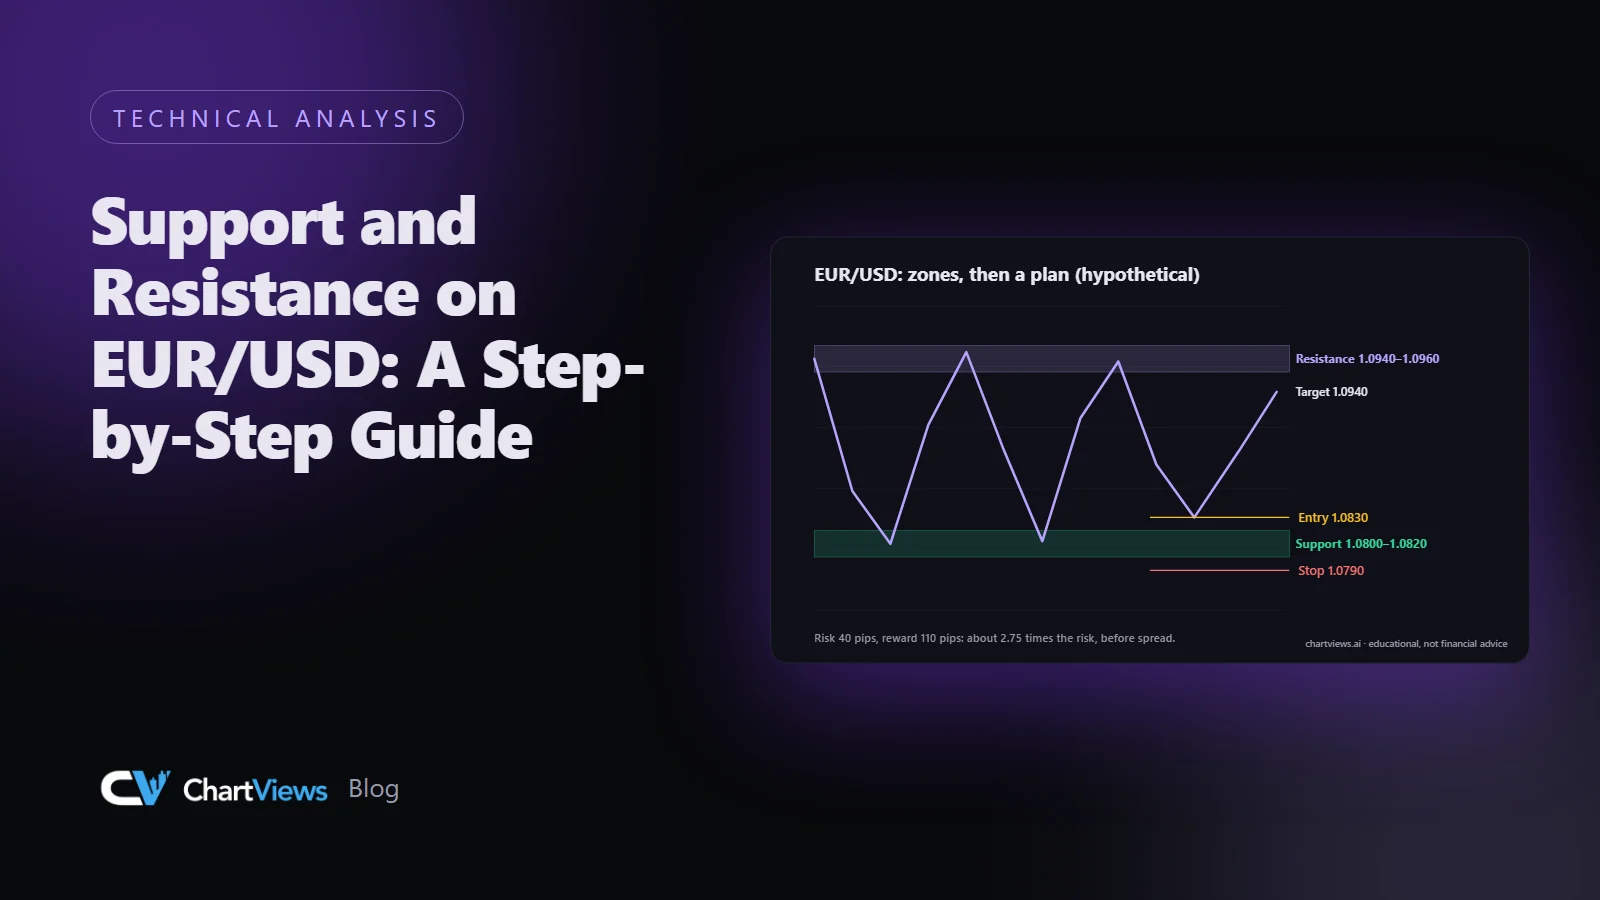
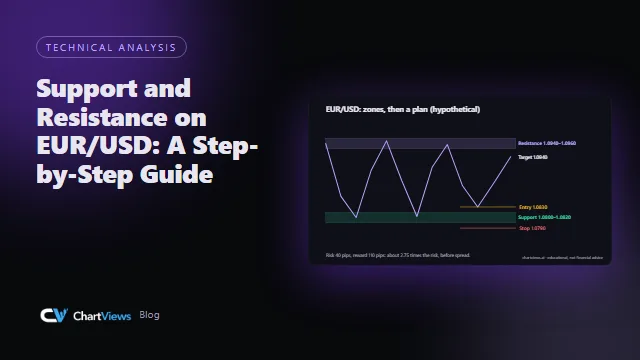
- Support and Resistance on EUR/USD: A Step-by-Step Guide
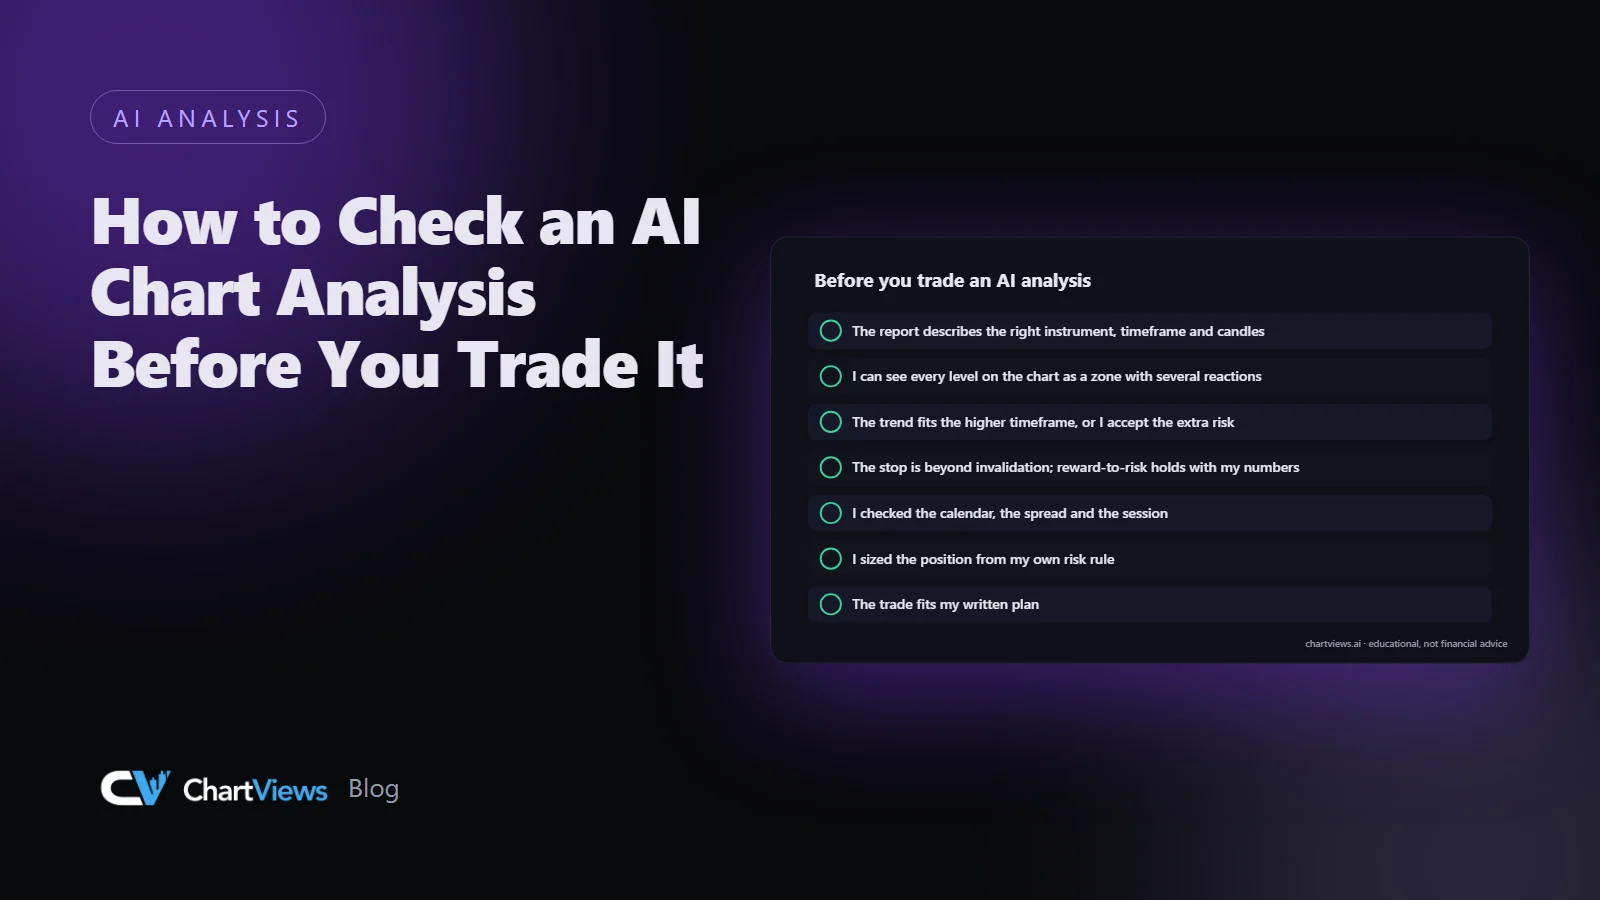
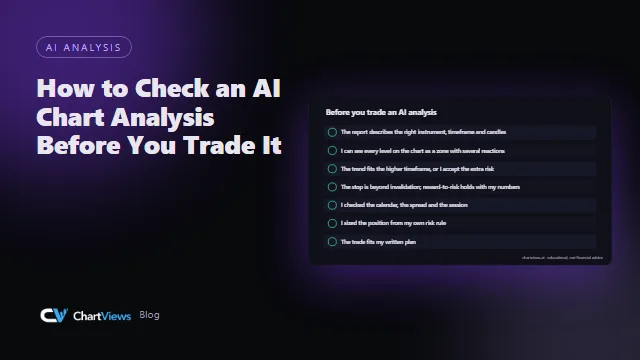
- How to Check an AI Chart Analysis Before You Trade It
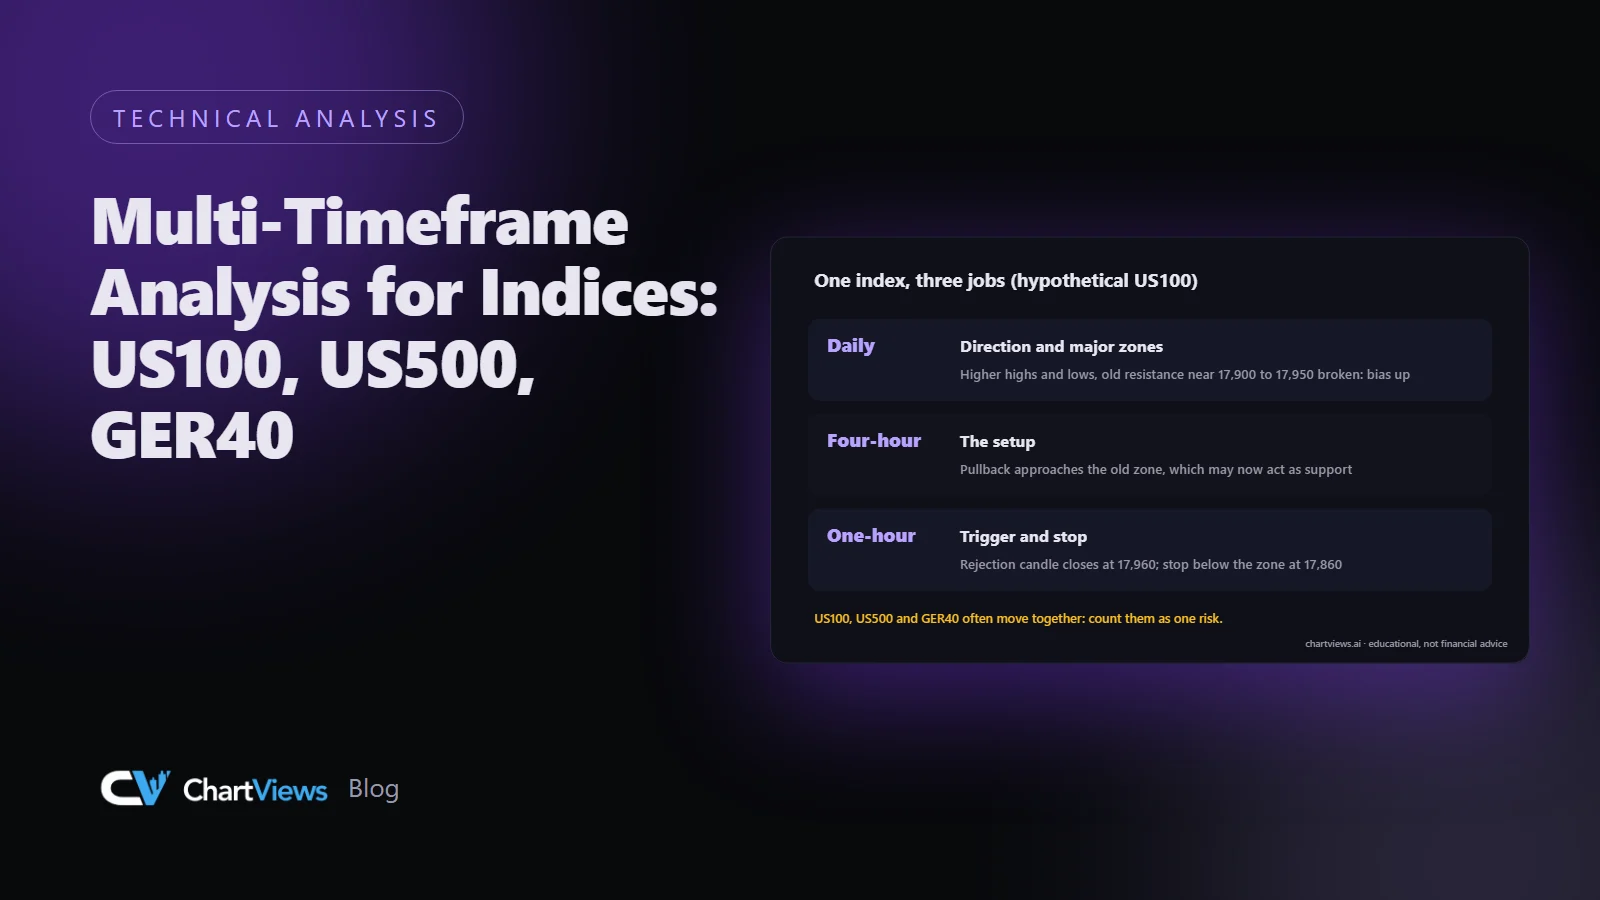
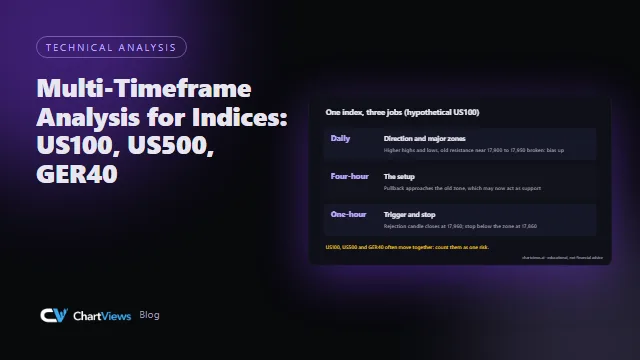
- Multi-Timeframe Analysis for Indices: US100, US500, GER40
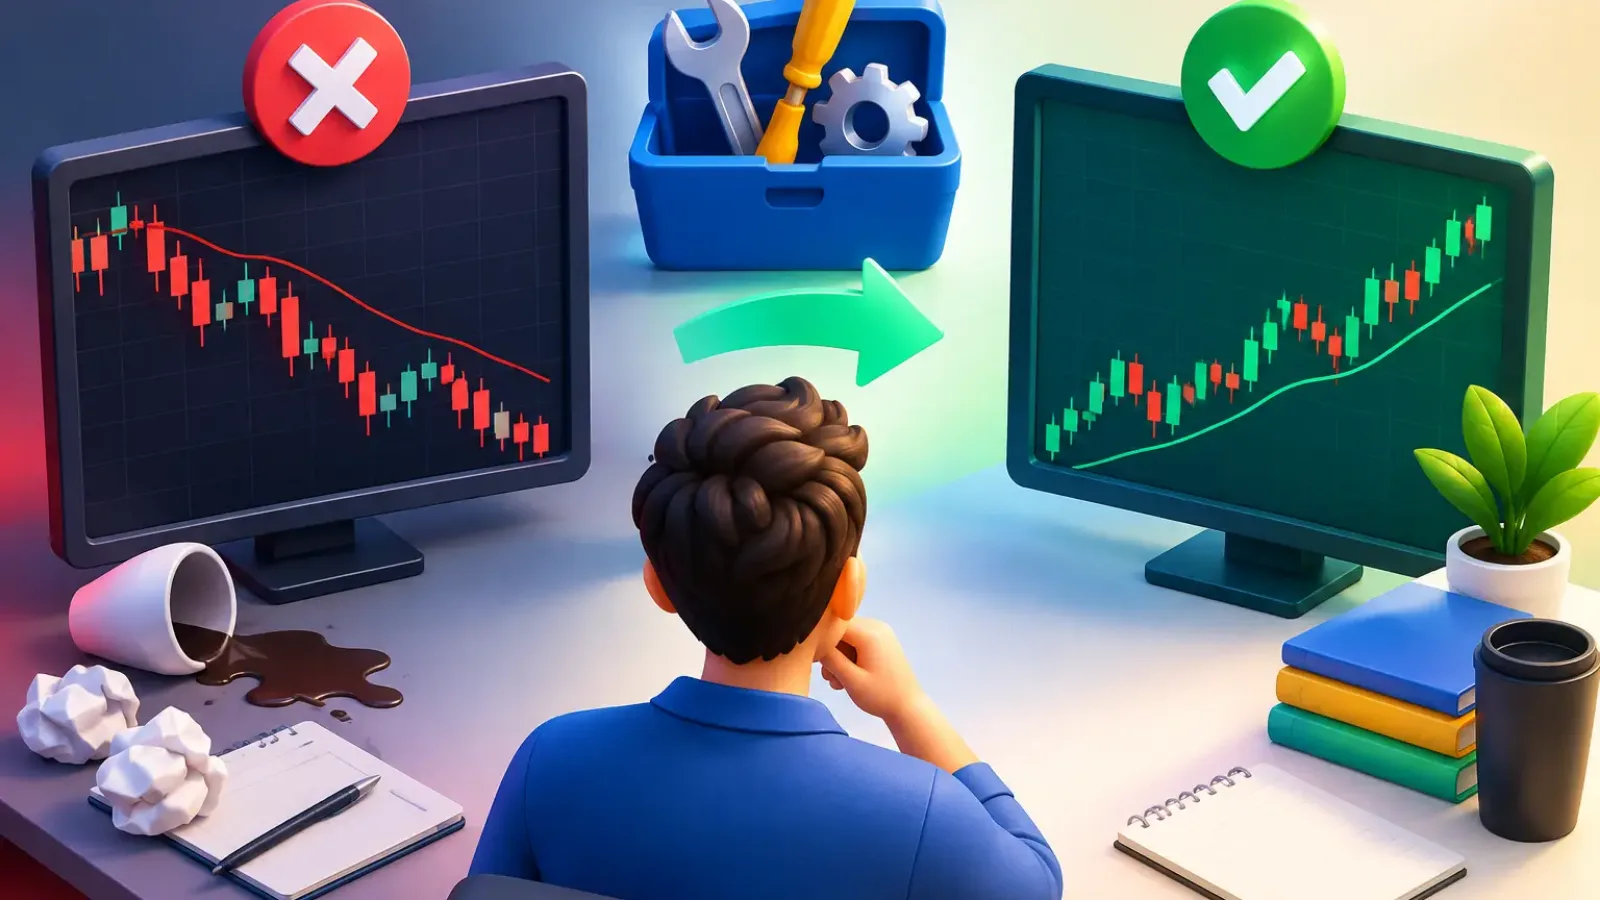
- Why Do Trade Setups Fail? 8 Fixes That Matter
- Multi Timeframe Alignment for Better Trades
- How to Filter False Signals Before You Trade
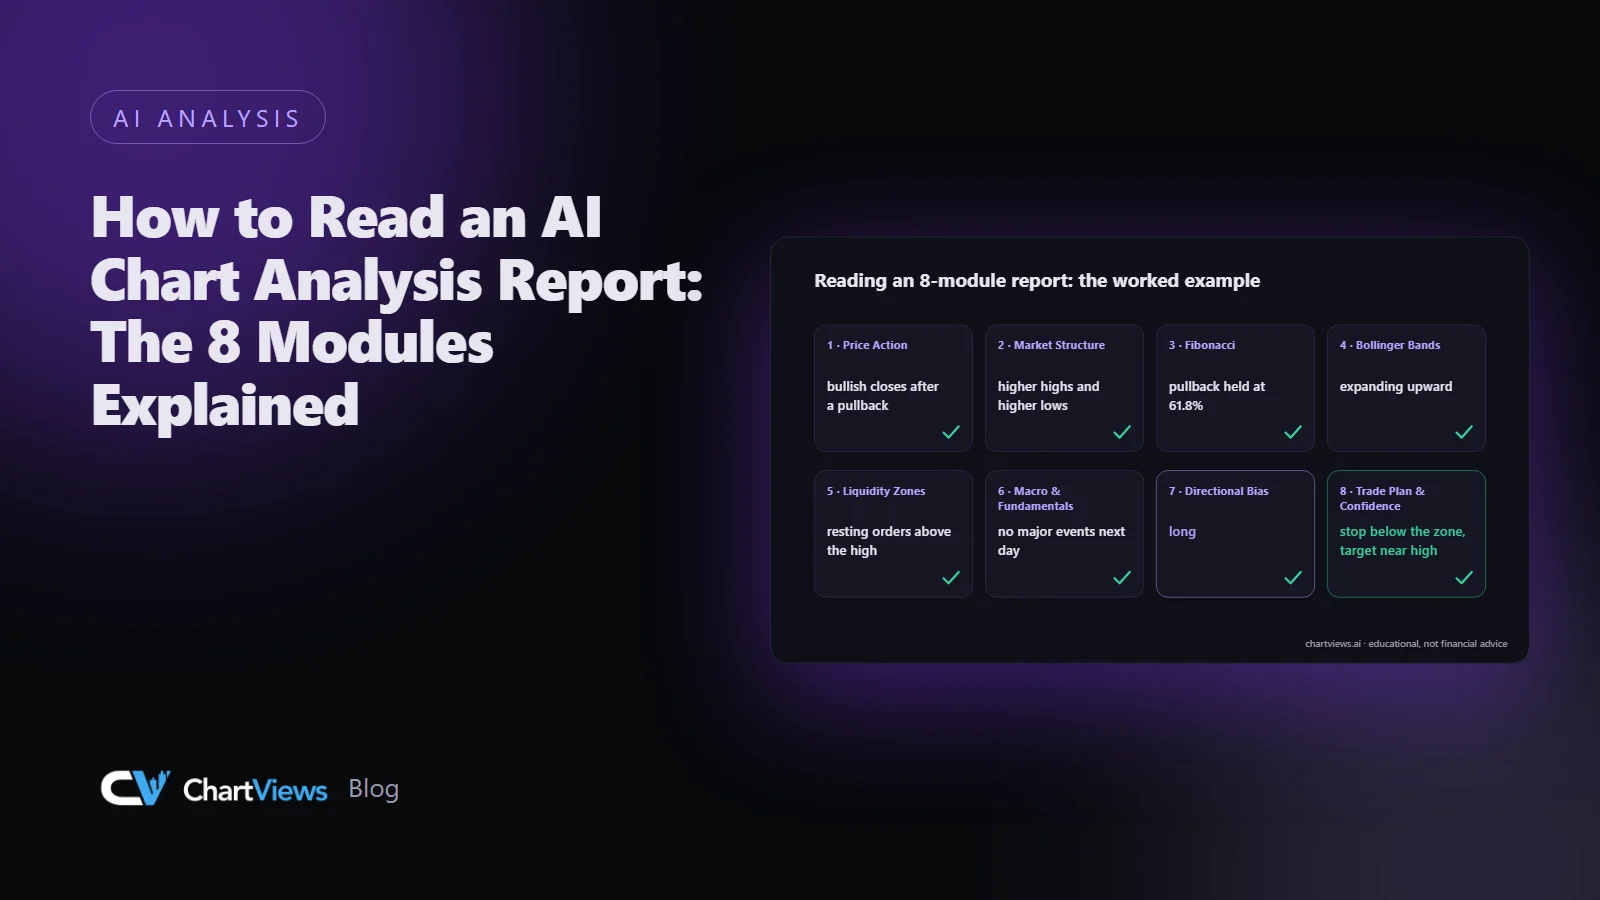
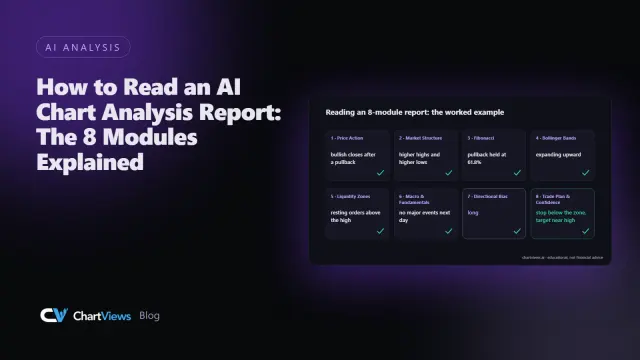
- How to Read an AI Chart Analysis Report: The 8 Modules Explained
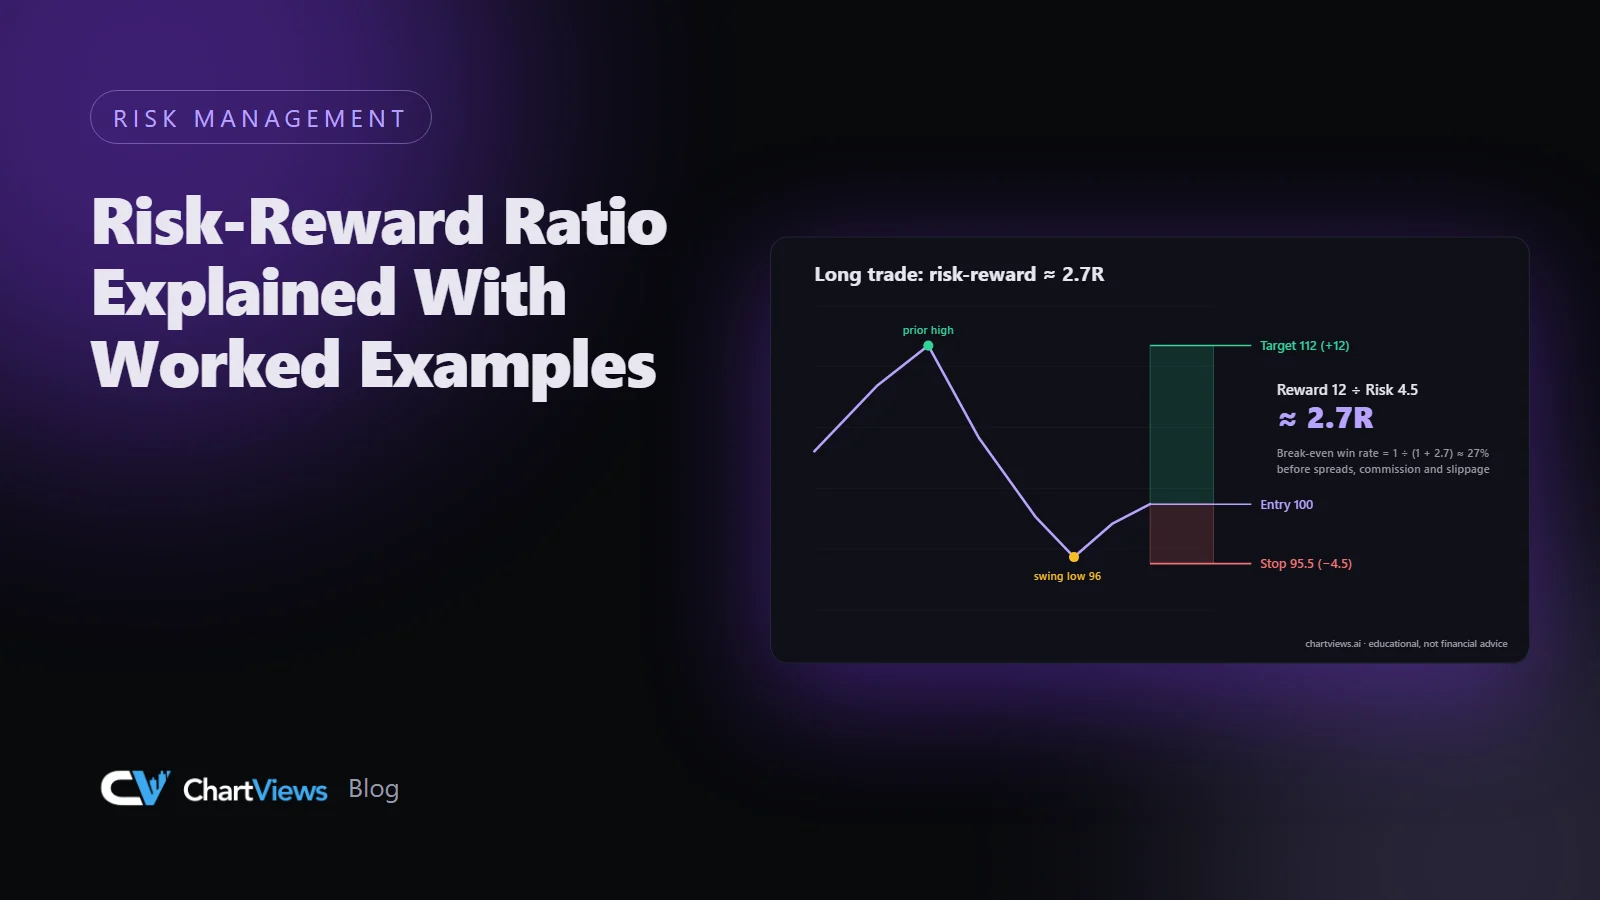
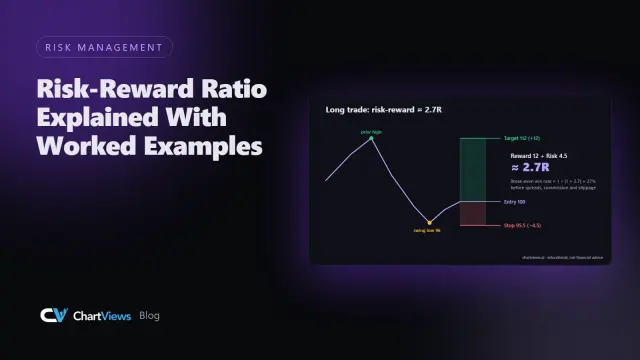
- Risk-Reward Ratio Explained With Worked Examples
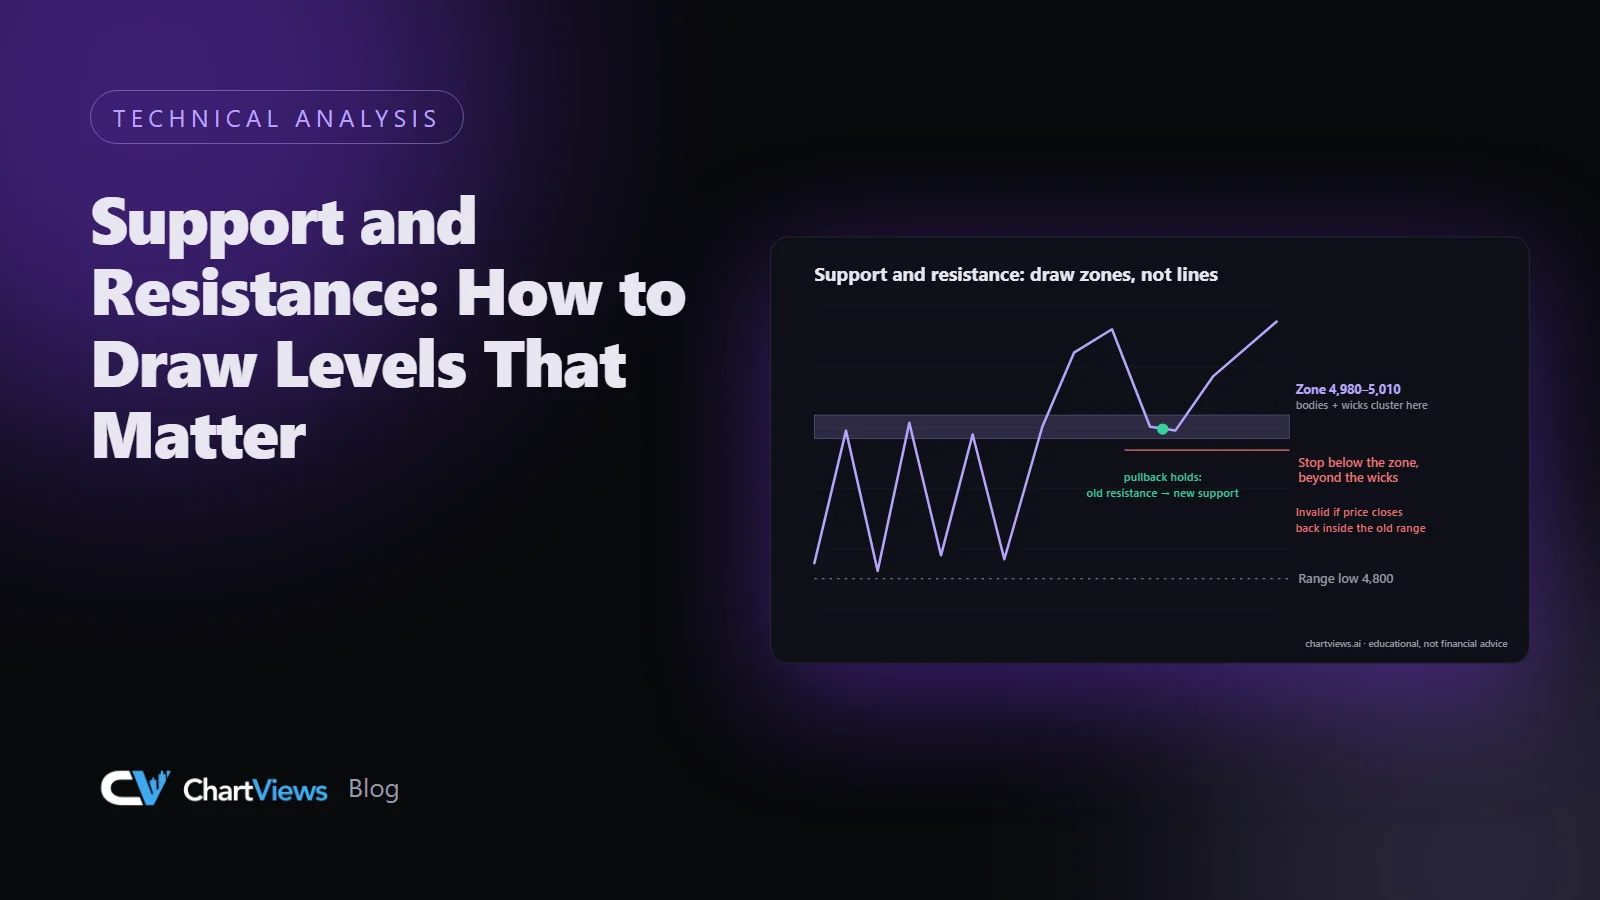
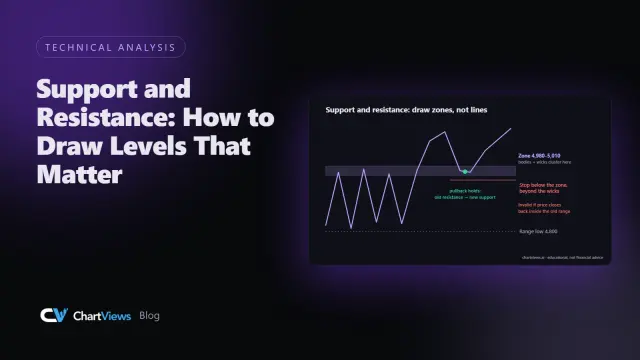
- Support and Resistance: How to Draw Levels That Matter
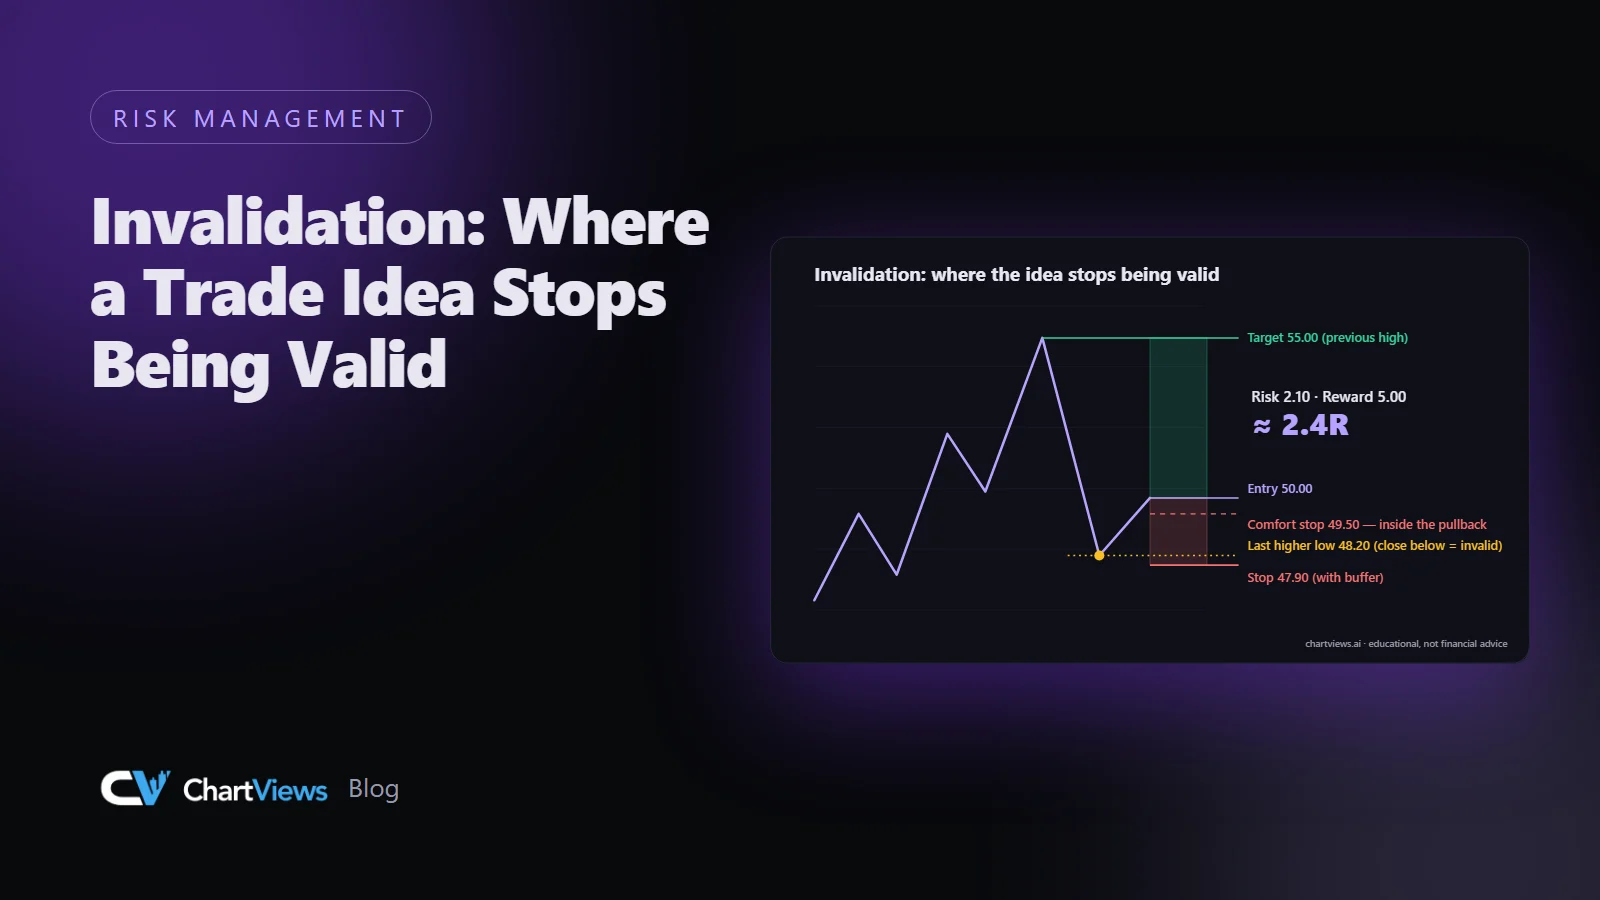
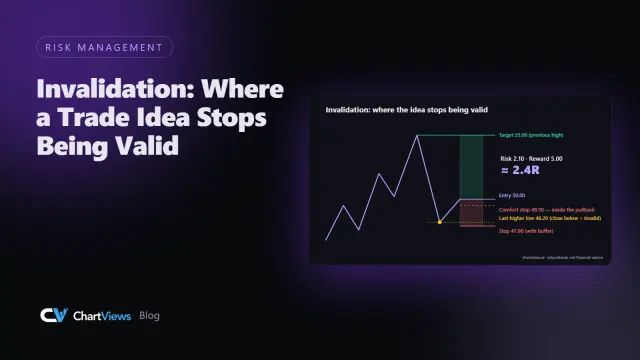
- Invalidation: Where a Trade Idea Stops Being Valid
- Position Sizing Basics: Risking a Fixed Percentage
- Asking ChatGPT About a Chart vs a Structured Analysis Tool
- How to Assess Trade Risk Before You Enter
- Key Metrics Before Entering Trades That Matter
- AI Chart Scanner Versus Indicators: What Wins?
- How to Validate Chart Setups Before You Trade
- Chart Interpretation Versus Signal Service
- Why Traders Second Guess Entries and Miss Trades
- How to Validate Chart Signals Before You Trade
- How to Automate Chart Annotations for Faster Trades
- Multi Timeframe Analysis for Better Trade Timing
- Technical Indicators Comparison for Better Trades
- Do Chart Screenshots Affect Analysis? What Traders Miss
- Swing Trader Analysis Example: A Real Setup
- How to Set Stop Loss Levels Without Guesswork
- What Causes False Breakouts? A Trader's Guide
- Trading Copilot Review: Is It Worth Using?
- A Practical Guide to Risk Reward Mapping
- How to Rank Trade Setups Before You Risk Capital
- Trade Setup Analysis Example for Better Entries
- 8 Best Tools for Trade Planning for Active Traders
- What Is Price Confluence in Technical Trading?
- How to Compare Timeframe Bias Before You Trade
- 7 Top Chart Analysis Mistakes That Cost Trades
- How to Analyze Stock Screenshots for Better Trades
- 7 Best Ways to Spot Breakouts Before They Run
- AI Chart Review for Swing Trading That Saves Time
- Chart Upload Trading Analysis Tool for Faster Setups
- How to Analyze Forex Charts With a Clear Process
- Manual Charting vs AI Workflow for Active Traders
- How to Avoid Analysis Paralysis in Trading
- 7 Best Support Resistance Indicators for Traders
- Trading Chart Analysis Guide for Better Timing
- A Guide to Trading Decision Support That Works
- Technical Analysis vs Chart Automation for Traders
- Best Tools for Chart Analysis for Faster Trades
- Breakout Confirmation Strategies for Fewer False Signals
- Chart Scanner vs Manual Analysis for Traders
- How to Check Resistance and Support Levels
- How to Validate Breakout Setups Before Entry
- How to Reduce Trading Analysis Paralysis
- Trade Entry Timing Guide for Clearer Setups
- A Trader's Guide to AI Chart Interpretation
- How to Set Trade Exits With a Clear Plan
- When Should Traders Exit Positions? A Clear Plan
- 7 Best Ways to Confirm Entries Before You Trade
- AI in Technical Analysis for Faster Trades
- Manual Chart Review vs AI for Traders
- Chart Analysis Software Review for Traders
- AI Chart Analysis vs Indicators
- Technical Analysis Software Comparison
- The Future of AI Trading Analysis
- Market Analysis Software for Traders
- How to Read Trading Charts Clearly
- Guide to Entry Exit Strategy for Traders
- Can AI Improve Trade Timing? Yes, With Limits
- How to Plan Trade Entries With Precision
- Trading Chart AI Tool Review for Active Traders
- How Entry Exit Signals Improve Trade Timing
- Technical Analysis for Retail Traders
- How to Find Support Resistance Fast
- How to Find Breakout Levels That Matter
- AI Chart Analysis Example for Active Traders
- Why an Instant Chart Interpretation Tool Wins
- How to Read Candlestick Charts Fast
- AI Stock Analysis Review for Active Traders
- 7 Best Trend Analysis Software Tools
- What Are Support Resistance Zones?
- Upload Chart for Analysis and Trade Faster
- What Is Support Resistance in Trading?
- Can AI Analyze Stock Charts Well?
- AI Powered Trading Analysis That Saves Time
- 8 Best AI Chart Tools for Faster Trade Analysis
- How to Spot Market Trends Early
- Beginner Guide to Technical Analysis
- Support and Resistance Detection That Works
- What Is the Best Indicator for Trend Reversal?
- Best Trend Identifier Indicator for Traders
- 9 Best Trend Analysis Tools for Traders
- How to Identify a Trend on a Trading Chart
- Market Trend Identification That Improves Timing
- Trend Identification in Trading That Holds Up
- What Is Trading Analysis and Why It Matters
- Learn How to Analyse Forex Charts Fast
- How to Analyze Chart in Forex Clearly
- How to Analyse Trading Charts Fast
- AI Trading vs Manual Trading: Which Wins?
 Money Circle Blog
 Trader Reflect Blog