How to Check an AI Chart Analysis Before You Trade It
An AI chart analysis can turn a screenshot into a structured read in seconds: trend, support and resistance, possible scenarios, a suggested stop and target. That speed is useful, and it is also the reason to slow down before you act on it. A confident-looking report is still a reading of an image, and an image can be misread. The trade, and the money behind it, are yours.
This guide gives you a practical routine for checking any AI chart analysis before you trade it, whichever tool produced it. It covers what to verify, what an AI read cannot know, and why responsibility stays with you. It is educational, not advice, and nothing here says that any analysis will be right.
Why checking is part of the process
A good analyst, human or software, shows the reasoning so that you can test it. That is the idea behind a structured report: instead of one verdict, you get separate pieces (trend, levels, scenarios, risk) that you can check one by one. If an output cannot be checked, treat it as an opinion, not as a plan.
Checking also protects you from a quiet habit: letting a tool make the decision. If you notice that you place trades only because the report said so, the tool has replaced your plan, and you will not know what to do when it is wrong. Our guide to how to read an AI chart analysis report explains each part of the output. This article is about the step after reading it.

Step 1: confirm it read the right chart
Before anything else, check the basics, because everything else depends on them:
- Instrument and timeframe. Does the report describe the market and timeframe you uploaded? A screenshot with several panels or a cropped title can lead to the wrong symbol.
- Price scale. Are the prices in the report the same as on the chart's axis? A misread digit on a scale can shift every level.
- Date range. Does the report describe the most recent candles, or an earlier part of the image?
If any of these is wrong, discard the report and upload a cleaner image. See our note on whether screenshots affect the analysis.
Step 2: check every level on your own chart
Take each support and resistance level in the report and find it on the chart yourself. Ask:
- Did price react there more than once?
- Is it a zone or a single candle's wick?
- Does it sit near a round number, a previous high or low, or a clear swing point?
Levels that you cannot see on the chart should be dropped. Levels you can see are your starting points, and you may well adjust their edges. Our guide to how to validate chart setups lists more checks of this kind.
Step 3: compare the trend with a higher timeframe
An analysis reads the chart you gave it. A one-hour chart can describe an uptrend that is a small pullback inside a larger daily downtrend. Open the next one or two timeframes above and ask whether the report's trend statement fits. If it does not, the trade is against the larger picture, which does not make it wrong but does make it harder, and your risk should reflect that. See multi timeframe alignment.
Step 4: test the stop and the target against the market
A suggested stop and target are numbers. Check whether they work in the real market:
- Is the stop beyond invalidation? It should sit where the idea is no longer valid, not just where the arithmetic looks neat. Trade invalidation explains the principle.
- Is it wide enough for the instrument? Compare it with the typical candle range and the current spread. A stop inside normal noise will be hit by chance.
- Is the target realistic? Is there another level in the way before the target is reached?
Then recompute the reward against the risk yourself. A report may show a ratio such as 2 to 1; do the sum with the entry, stop and target you would actually use, including the spread. See risk-reward ratio explained.
Step 5: check what the image cannot show
An AI chart analysis sees a picture. It does not know:
- Scheduled events. A major data release or central bank decision within the next hours can overwhelm any chart pattern. Check the calendar.
- Your spread, commission and slippage. These change the real stop and the real reward.
- Liquidity and session. A level in a thin overnight session behaves differently from the same level during the main session.
- Your account. Your size, open positions, daily loss limit and any prop firm rules are invisible to it.
- Your plan. Whether the setup is one you have written rules for, and tested, is up to you.
Add these facts before you decide. They are the difference between a chart read and a trade decision.
Step 6: size the trade from your own rules
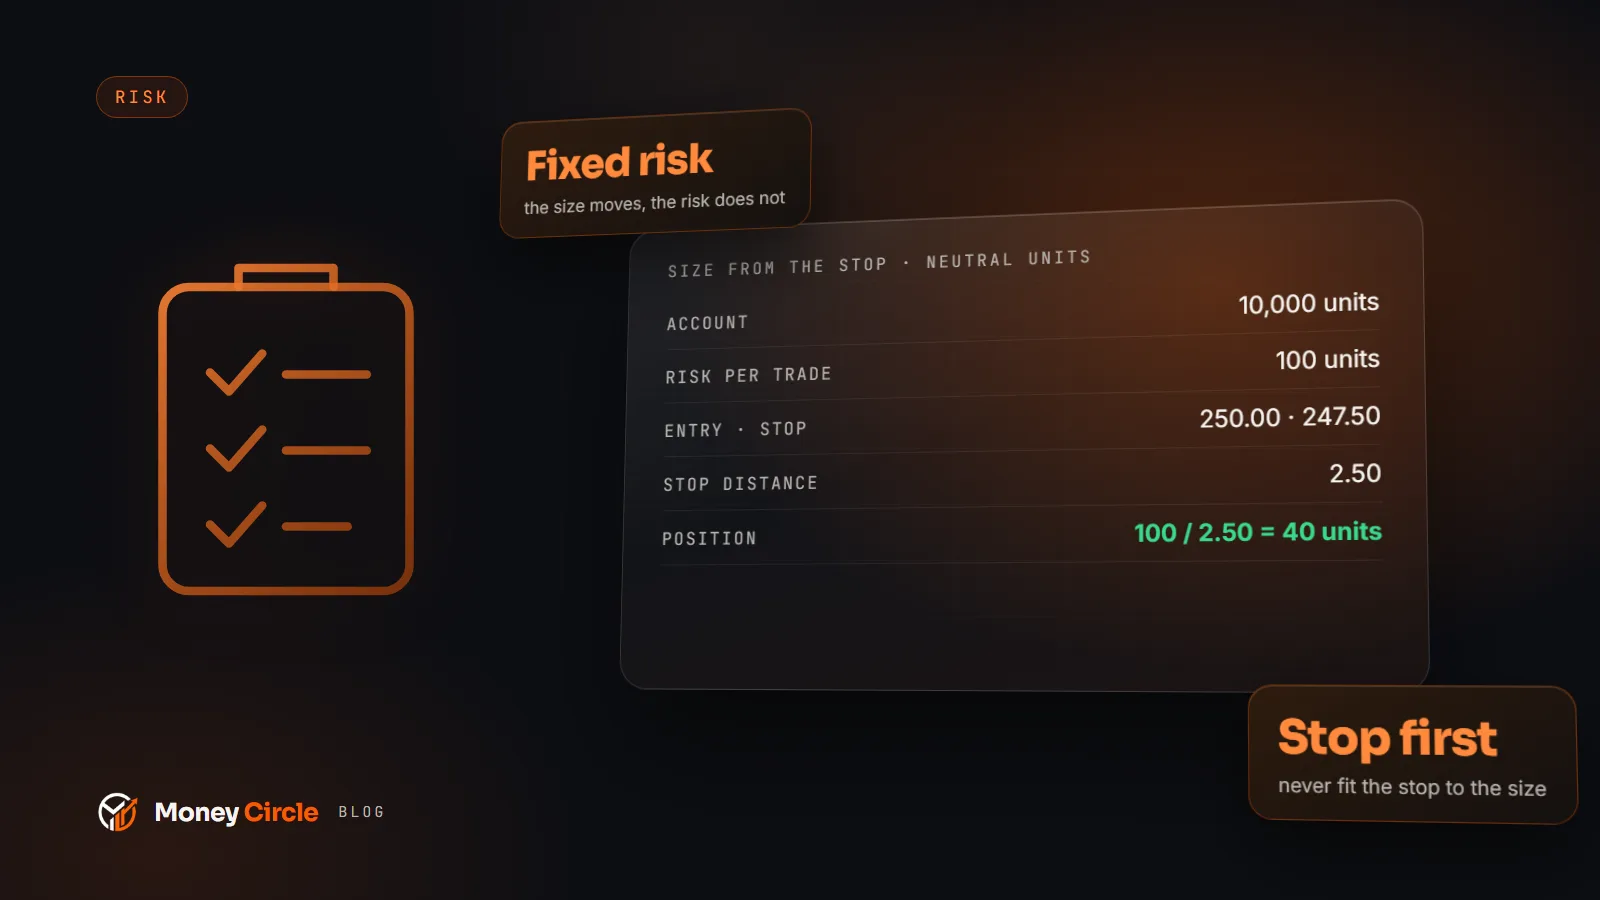
Position size comes from your risk per trade and the stop distance, not from the report. Decide the amount you are willing to lose, divide it by the stop distance in money per unit, and round down. Our guide to position sizing with fixed percentage risk gives the formula. If the correct size is too small to be worth the trade, skip it.
Step 7: decide whether it fits your plan
Last, hold the idea against your written plan. Is this a market you trade, in a session you trade, with a setup you have defined? Is the stop within your daily limit? Is it consistent with the rest of your open positions? If the answer to any is no, there is no trade, however good the report looks.
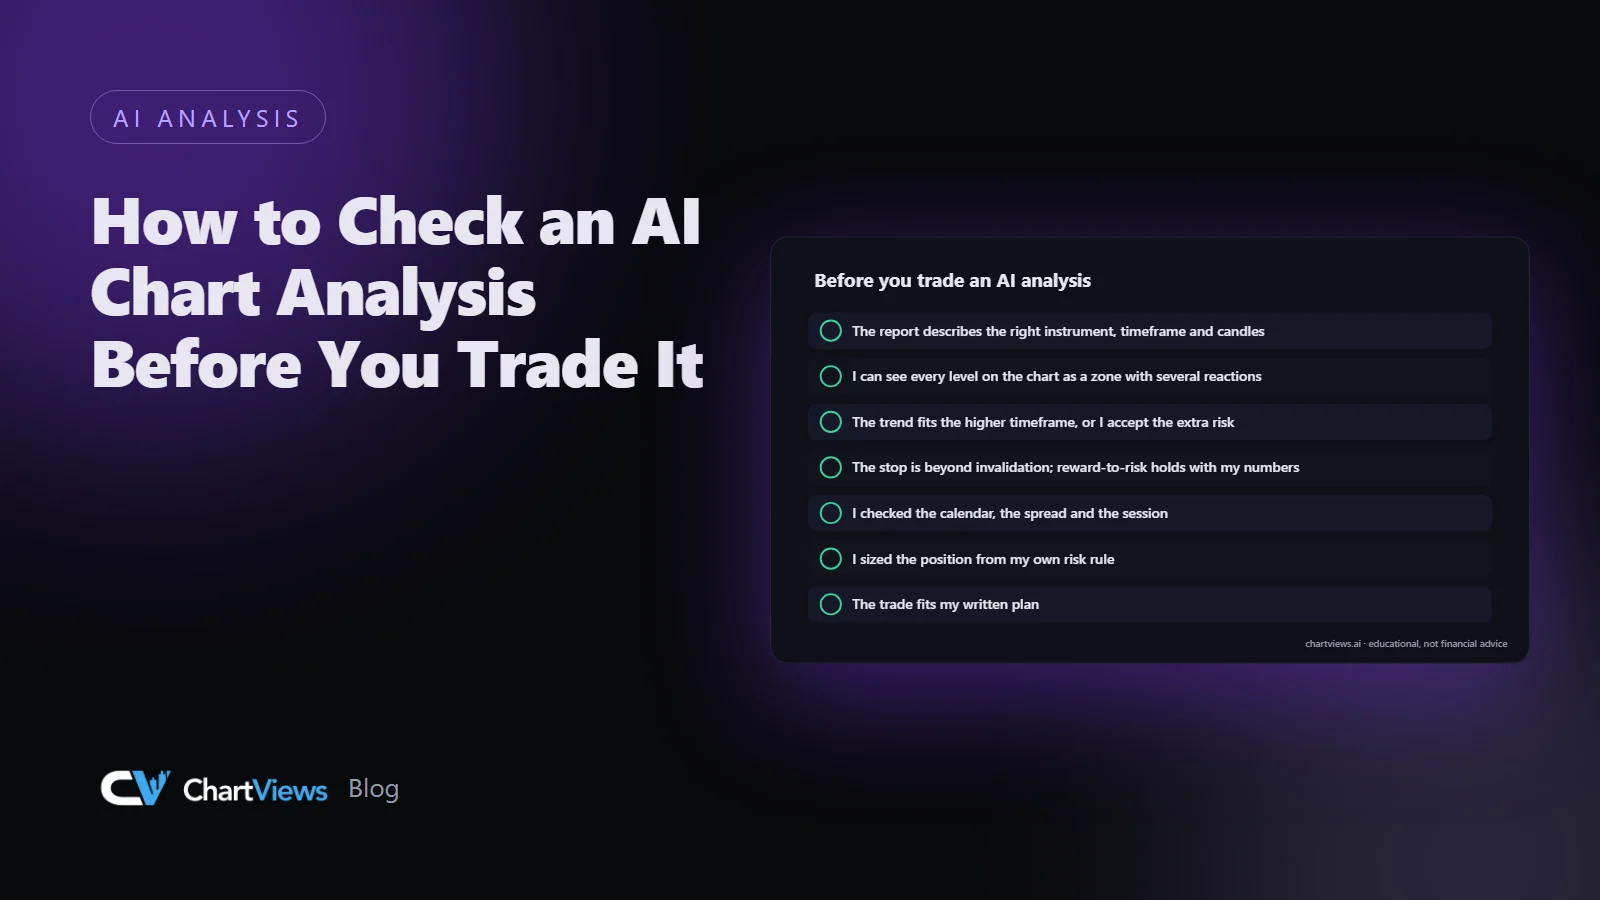
A pre-trade checklist
Print this or keep it beside your screen:
- The report describes the right instrument, timeframe and recent candles.
- I can see every level on the chart, as a zone with several reactions.
- The trend statement fits the higher timeframe, or I accept the extra risk.
- The stop is beyond invalidation, wide enough for the instrument, and the reward-to-risk holds with my own numbers.
- I checked the calendar, the spread and the session.
- I sized the position from my own risk rule.
- The trade fits my written plan.
If one of these fails, you have learned something useful. Write it in your journal and move on.
Why you stay responsible
An analysis is a tool for thinking. It does not know your goals, your account or your tolerance for loss, it has no knowledge of what happens next, and it cannot place or manage a trade for you. Markets can move against a well-reasoned idea, and no reading, human or automated, removes that possibility. If you take a trade, the decision, the size and the outcome are yours, which is also why checking pays off: a trade you have examined is one you can explain, review and learn from.
It also helps to keep score. Over a few weeks, record how often the report's levels and scenarios held up against your own judgement, and where you disagreed. That log tells you where the tool is helpful for your style and where you need to be more careful. Our guide to how to validate chart signals can help you set that up.
Using the tool well
Used this way, an AI analysis saves time on the first pass and leaves your attention for the parts that need judgement. You can see what each module covers on the features page, and the disclaimer sets out what the service does and does not do.
Want a structured read of your own chart to check against this routine? Run an analysis on ChartViews AI.
Educational content, not financial advice. Trading involves risk of loss.
 Money Circle Blog
 Trader Reflect Blog