Multi-Timeframe Analysis for Indices: US100, US500, GER40
Index charts behave differently from currency pairs. They gap at the open, they cluster their biggest moves around a few hours of the day, and the major ones move together. A trader who reads US100, US500 and GER40 on a single timeframe tends to see either noise or a trend that has already finished. Multi-timeframe analysis fixes that by giving each chart a job.
This guide shows how to apply a multi-timeframe routine to index markets, with a hypothetical example. The prices are invented round numbers for illustration, not a view on where any index will trade. It is educational, not advice. If you want the general method first, read multi timeframe analysis.
What makes indices different
They have sessions. A cash index is built from stocks that trade during exchange hours. The US market opens at 9:30 New York time, and the German market opens at 9:00 Central European time. Many index CFDs trade nearly around the clock, but the quiet overnight hours and the busy cash-open hours behave very differently.
They gap. Because of the overnight break, price can open away from the previous close. A stop placed below a level can fill beyond it. This affects how you place and size stops.
They are correlated. US100, which is technology-heavy, US500, which is broader, and GER40 often move in the same direction on a global risk theme, though not always, and not by the same amount. Taking a long on each is closer to one large position than three small ones.
They are quoted in points. Distances are measured in points, and the value of a point depends on your broker's contract. Always check before you size a trade.

Give each timeframe a job
A simple stack for a swing-style approach is:
- Daily (and weekly): direction and major levels. Is the market trending, ranging or turning? Where are the big zones?
- Four-hour: the setup. Where is price relative to the daily levels? Is there a pullback or a range forming?
- One-hour or fifteen-minute: the trigger and the stop. Where, exactly, would the idea be proven wrong?
For a shorter holding period, shift everything down: four-hour for direction, one-hour for the setup, five-minute for the trigger. The exact intervals matter less than the hierarchy. Whatever you choose, write it in your plan, and stick to it for a few weeks before changing it.
A hypothetical walk-through on US100
Suppose a US100 chart looks like this, using invented numbers.
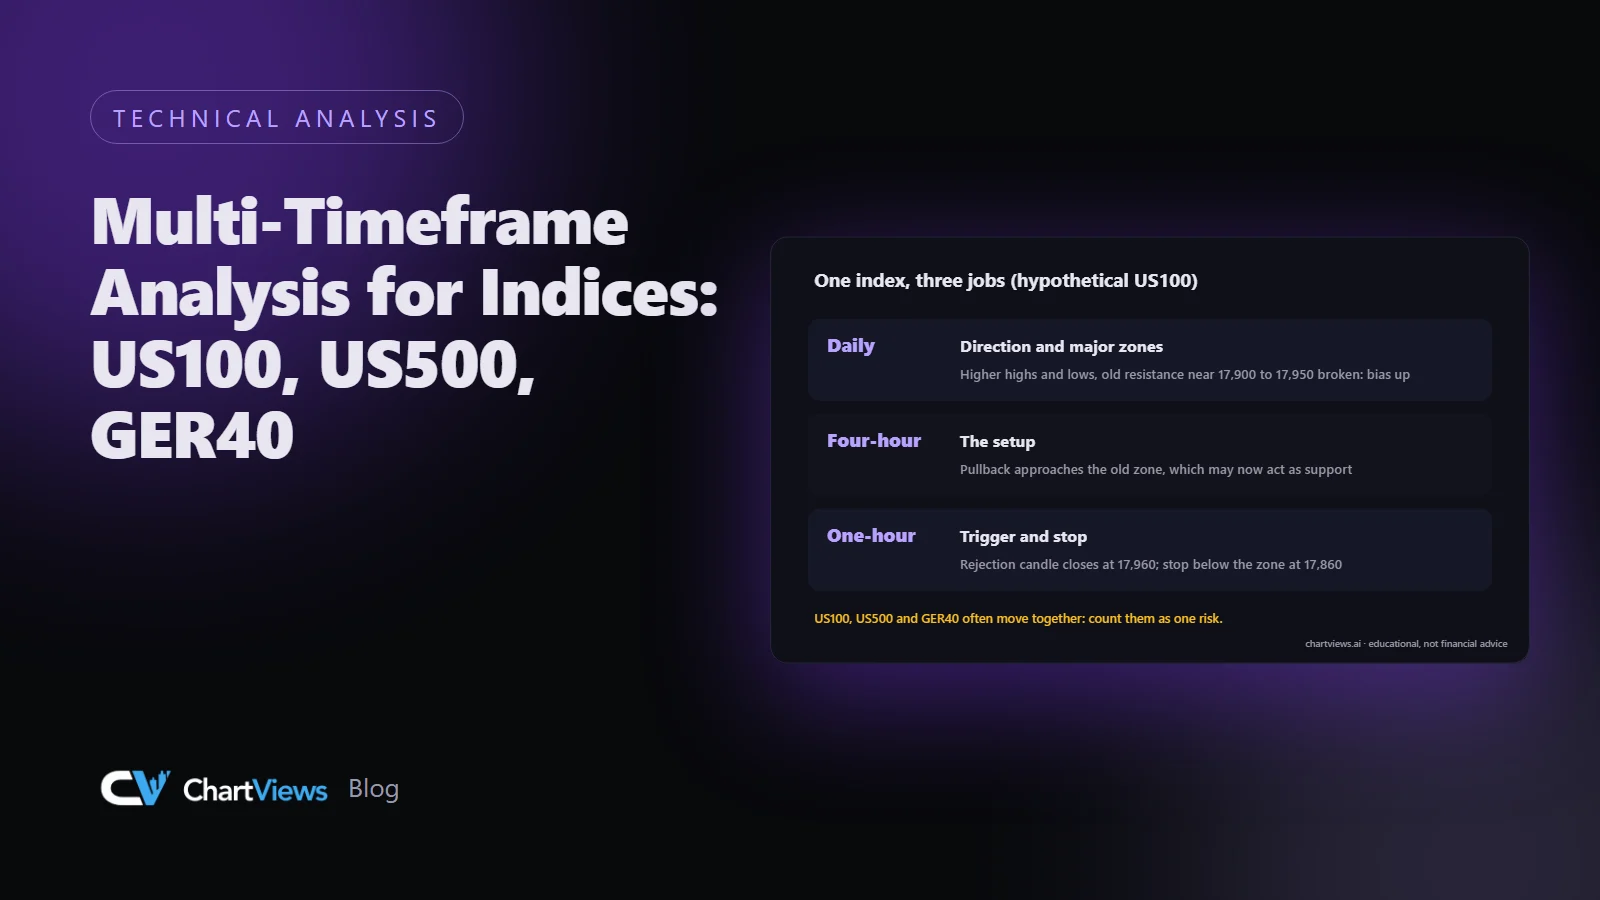
Daily: the index has made higher highs and higher lows for several weeks. The most recent swing high is near 18,400, and a prior resistance zone around 17,900 to 17,950 was broken a few weeks ago. The bias, from this timeframe, is up.
Four-hour: price has pulled back from 18,400 and is now approaching the old resistance zone at 17,900 to 17,950, which could act as support. That is the area of interest.
One-hour: price has reached the zone and is forming smaller candles with long lower wicks. A bullish engulfing candle closes at 17,960. That is the trigger in this example.
The plan: a long, from the trigger area, with a stop below the zone and its wicks, say at 17,860. A target at the previous high near 18,400. The stop is about 100 points from the entry and the target about 440 points away, so the reward is roughly 4.4 times the risk before spread. All hypothetical.
Then comes the check. If the daily chart were in a downtrend, the same one-hour signal would be a counter-trend trade, and it deserves a much smaller position or a pass. Our guide to multi timeframe alignment looks at how to weigh a conflict between timeframes.
What to do when timeframes disagree
Conflict is normal, and it is information. Three common responses:
- Follow the higher timeframe. If the daily is up and the one-hour is down, the one-hour is probably a pullback. Wait for it to end before you look for a long.
- Stand aside. If you cannot say which timeframe is in charge, there may be no trade. Waiting is a valid result.
- Trade smaller and close. If you take a counter-trend trade, use a smaller position, a nearer target and a firm stop. Do not let it become a swing trade because it is moving your way.
What you should avoid is searching timeframes until you find one that agrees with the trade you already wanted. That is confirmation bias dressed as analysis.
Add the market context
Before the trigger, check three things that are specific to indices:
- The calendar. Major US releases, central bank decisions and big earnings from index heavyweights can move indices sharply. Decide in advance whether you will be in a trade through them.
- The open. The first fifteen to thirty minutes after a cash open are often fast and untidy. Some traders wait for the opening range to form before acting, others avoid the open entirely. Decide which you are, and write it down.
- The gap. If price opened away from yesterday's close, note whether it is filling the gap or running from it, and mark the gap edges on your chart as potential reaction areas.
Count correlated risk once
If US100 and US500 both show a long setup at the same time, that is not two independent chances. It is mostly the same view on the same market theme. Treat them as one position for risk purposes: either take one, or split your intended risk between them. Adding GER40 as a third long does not change that picture much when the driver is global risk sentiment.
Our guide on how to assess trade risk explains how to add up the open risk across positions, and position sizing with a fixed percentage of risk gives the sizing formula. For an index, the stop distance is in points, so you need the money value of one point per lot before you calculate.
Stops and gaps
Because indices can gap, a stop is not a guarantee of the exit price. You can plan for it:
- Keep your risk per trade small enough that one worse fill is survivable.
- Think carefully about holding positions overnight or through a major event.
- Place stops beyond structure, using the higher timeframe for the level and the lower timeframe for the exact place.
See how to set a stop loss for the principle of putting a stop where the idea is invalid.
A daily routine for an index trader
- On the daily and weekly charts, mark direction and the three to five key zones for each index you follow.
- Check the economic calendar and write the times of any major release for the session.
- On the four-hour chart, find which index is near a zone and write one sentence for each scenario.
- Wait for your trigger on the lower timeframe, and do nothing if it does not arrive.
- Size the trade from the stop, and log it with the reason, the timeframe stack and your own rating of how well the timeframes agreed.
After a few weeks, your journal will show whether trades with full timeframe agreement did differently from those without, for you, in your own data. That is more useful than any rule of thumb.
Where an AI read can help
Running a stack of charts takes time, and a structured analysis can speed up the first pass. You can upload the daily, four-hour and one-hour chart of the same index to ChartViews AI and compare the trend and level readings across timeframes, then check them against your own marks. It is a way to get a consistent first read, not a prediction, and the decision about whether and how to trade remains yours. See the features page for what each analysis includes.
Want a structured second read across your timeframes? Run an analysis on ChartViews AI.
Educational content, not financial advice. Trading involves risk of loss.
 Money Circle Blog
 Trader Reflect Blog