How to Read an AI Chart Analysis Report: The 8 Modules Explained
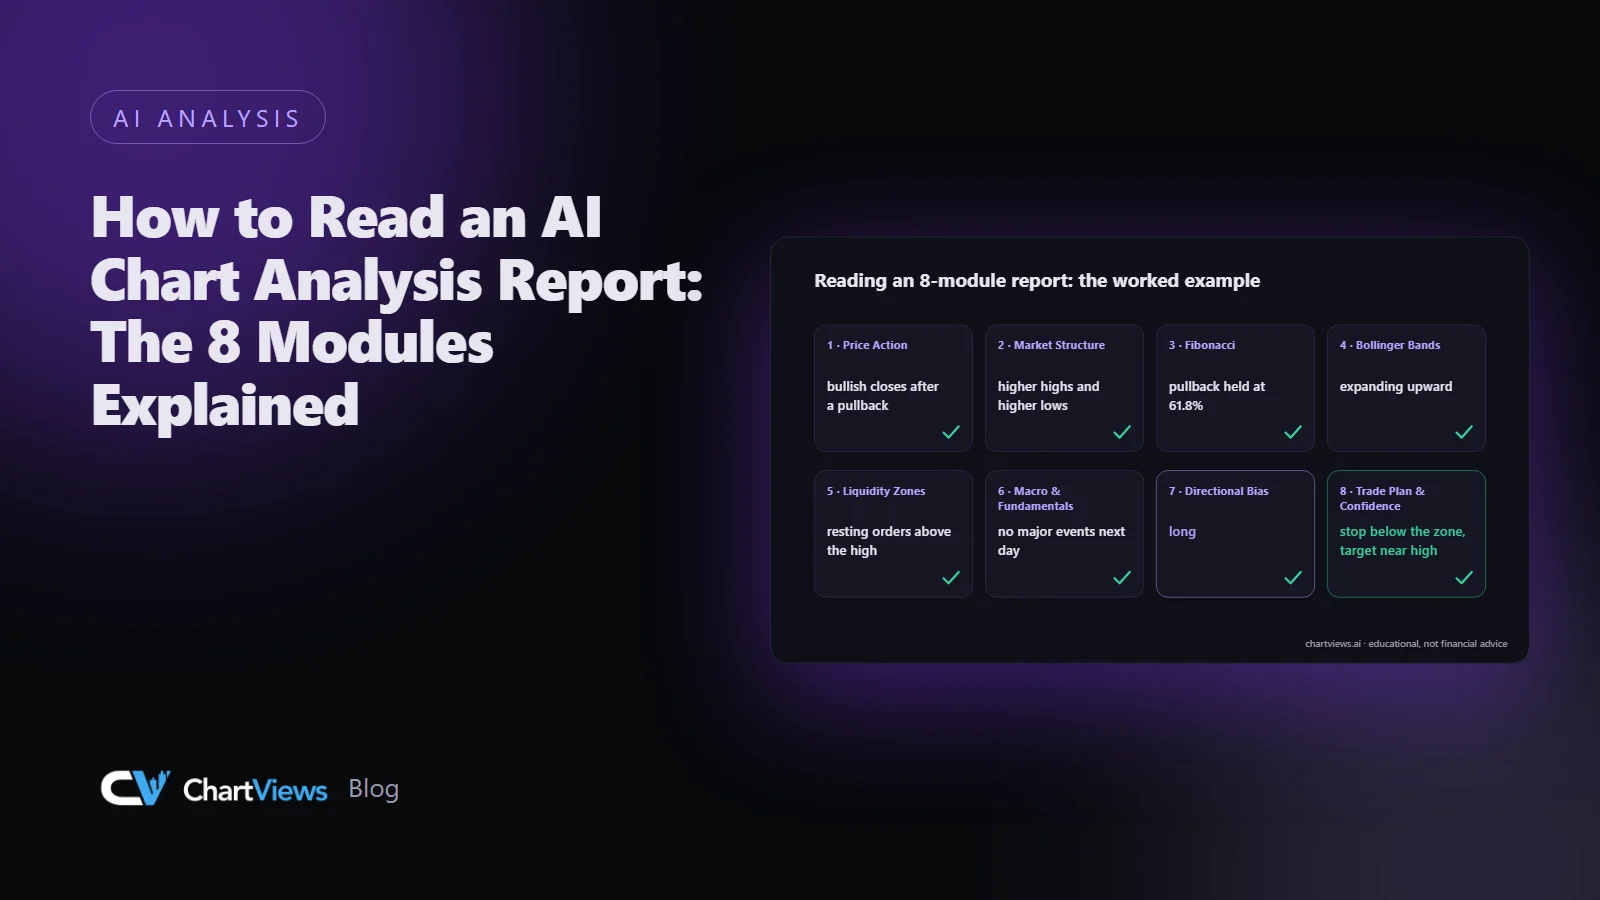
A chart analysis report is only useful if you know what each part is telling you, and, just as important, what it is not telling you. A structured report from ChartViews AI is split into eight modules. Each looks at the same chart through a different lens, and the value comes from how they agree or disagree. This guide explains what every module does, how to read it, and how to combine them into one decision.
Why a report is split into modules
A single indicator rarely tells the whole story. A trend can be intact while price sits at a stretched volatility extreme. A clean pattern can sit right in front of a major news event. Splitting the analysis into modules forces each question to be answered separately, so you can see where the evidence lines up and where it does not.
Think of the modules as a checklist that moves from the most basic observations (what are the candles doing?) to the most practical output (where would a trade be entered, stopped and targeted?).
The eight modules
1. Price Action
This module reads candle behaviour, swings and momentum. It answers questions such as: are candles closing near their highs or their lows, are ranges expanding or shrinking, and is momentum building or fading? Long wicks, strong closes and small-bodied candles all carry information about who is in control.
How to use it: treat it as the foundation. If price action is messy and overlapping, the rest of the report should be read with extra caution.
2. Market Structure
Market structure describes the sequence of swing highs and swing lows. Higher highs and higher lows describe an uptrend; lower highs and lower lows describe a downtrend; overlapping swings describe a range. This module also flags where structure has recently shifted.
How to use it: structure sets the context for direction. A long idea inside a downtrend needs a stronger reason than a long idea inside an uptrend.
3. Fibonacci
Fibonacci retracement and extension levels mark zones where pullbacks or continuations are commonly watched. The useful signal is confluence: a retracement level that lines up with a previous swing or a support zone is more interesting than a level floating in empty space.
How to use it: do not treat any single ratio as magic. Treat the zones as areas of interest that need confirmation from price action.
4. Bollinger Bands
Bollinger Bands show a volatility envelope around a moving average. Tight bands suggest low volatility and often precede larger moves in either direction; wide bands show that volatility is already elevated. Price at an outer band can mean strength in a trend or a stretched move in a range, depending on structure.
How to use it: read it together with market structure. The same band touch means different things in a trend and in a range.
5. Liquidity Zones
Liquidity zones mark areas where many orders are likely to rest, such as above obvious highs or below obvious lows. Price sometimes sweeps these areas quickly and then reverses, which is why stops placed exactly at obvious levels are often hit.
How to use it: it helps you place stops beyond the obvious cluster rather than right on it, and it warns you when a breakout may be a sweep instead.
6. Macro & Fundamentals
This module adds context that a chart cannot show: scheduled economic events, catalysts and general sentiment. A technically attractive setup just before a major data release carries a different risk profile.
How to use it: check it for timing. Even when you ignore fundamentals in your own approach, knowing that a high-impact event is minutes away should influence size and stop placement.
7. Directional Bias
Here the earlier modules are summarised into an overall read: long, short or wait. Wait is a legitimate answer. If the modules conflict, a report that says there is no clear edge is more honest than one that forces a direction.
How to use it: read the bias as a summary of the evidence, not as an instruction. Look at which modules support it and which argue against it.
8. Trade Plan & Confidence
The final module turns the read into numbers: a possible entry, a stop-loss, one or more targets, the resulting risk-reward ratio and a confidence score. The stop-loss is where the idea is invalidated, and the targets are where the move may run into resistance or support.
How to use it: check that the stop sits at a logical structural level, that the targets are reachable, and that the risk-reward still makes sense after you adjust the entry to what you can actually get in the market.
A worked example, described in words
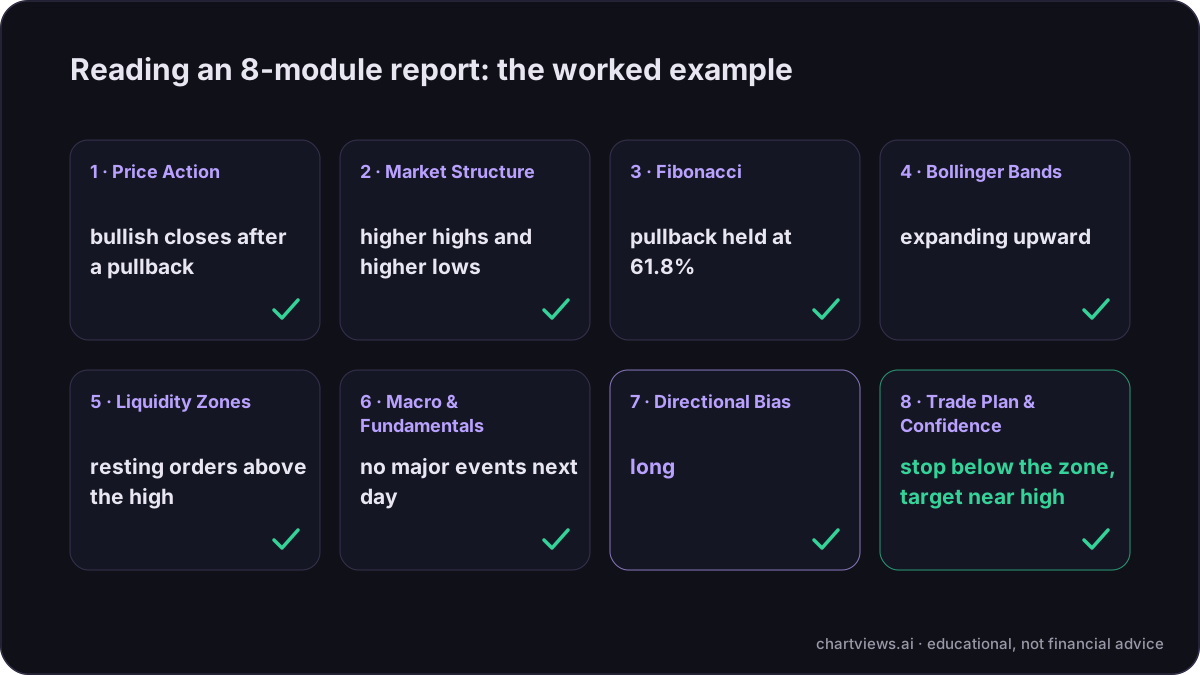
Imagine a report on a currency pair on the four-hour chart. Price action shows strong bullish closes after a pullback. Market structure shows higher highs and higher lows, so the trend is up. Fibonacci shows that the pullback held at the 61.8 percent retracement, which also lines up with a prior swing high that has turned into support. Bollinger Bands are expanding upward, which fits a trend rather than a range. Liquidity zones show resting orders above the recent high, which is a plausible magnet for price. Macro shows no major events for the next day. The directional bias reads long, and the trade plan sets a stop just below the retracement zone with a first target near the recent high.
Notice what happened: six independent lenses agreed, and the plan was built on the structure rather than on a hunch. Now imagine the same chart with a central bank decision due in one hour. The technical modules would be identical, but the macro module would change how much risk you take, or whether you wait.
How to combine the modules
- Start with Market Structure to know the direction of the larger picture.
- Use Price Action to judge whether momentum currently supports it.
- Use Fibonacci, Liquidity Zones and Bollinger Bands to decide where price might react.
- Check Macro & Fundamentals for timing risk.
- Read the Directional Bias as the summary and compare it to your own view.
- Finish with the Trade Plan & Confidence module and decide whether the risk-reward and stop placement fit your rules.
Common mistakes when reading a report
- Reading only the confidence score. A number without the reasoning behind it hides the modules that disagree.
- Ignoring the wait signal. Not trading is a position too.
- Moving the stop to make the numbers work. If the risk-reward only looks good with a stop that is too tight, the setup is not good.
- Treating the report as a prediction. It is a structured description of the chart as it looks now. Markets can and do move against well-reasoned ideas.
Where to go from here
The best way to learn is to compare reports with what price actually does afterwards, and to note which modules were most useful for the way you trade. You can try a free analysis and open each module in turn to see the structure in practice: analyze a chart. For a feel of the output, browse the example reports.
Educational content, not financial advice. Trading involves risk of loss.
 Money Circle Blog

 Trader Reflect Blog