How to Assess Trade Risk Before You Enter

A clean chart can still produce a bad trade if the downside is undefined. The real edge is not finding a setup that looks promising. It is knowing how to assess trade risk before your order is live, so one wrong call does not damage your account or force emotional decisions on the next trade.
Risk assessment turns chart analysis into a repeatable decision process. Before entering, define where the idea fails, calculate what that failure costs, and decide whether the potential reward justifies taking the position. If those pieces do not align, the trade is not ready - no matter how convincing the pattern appears.
Start With the Invalidation Level
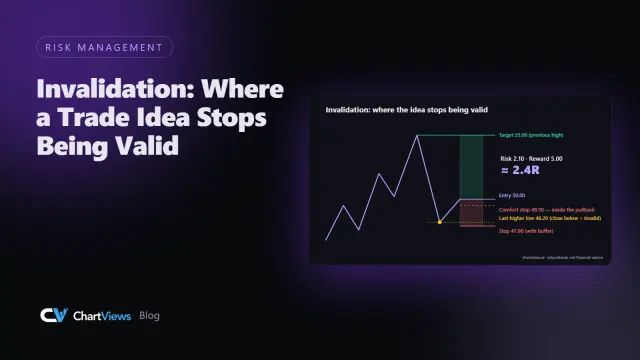
Every trade needs a clear point of invalidation. This is the price level that proves your original thesis is wrong. It is not a random percentage stop or the point where a loss starts to feel uncomfortable.
For a long trade, invalidation might sit below a confirmed support level, the latest higher low, or a breakout level that should hold after price moves above it. For a short trade, it may sit above resistance, a lower high, or the upper boundary of a consolidation range.
The chart structure should determine the stop location. A stop placed too tightly can be caught by normal price noise. A stop placed too far away may make the trade too expensive to take. The right distance depends on the instrument, timeframe, and current volatility.
This is where support and resistance matter beyond simple entry timing. These levels show where market participants have previously defended price or changed direction. If price breaks through a level that supports your thesis and holds there, your setup has changed. Exit according to the plan rather than searching for a reason to stay in.
Calculate Dollar Risk Before Position Size
Many traders make the same mistake: they choose a position size first, then place a stop wherever it fits. Reverse that process.
First, identify your entry and invalidation level. The difference between them is your risk per share, contract, coin, or unit. Then decide the maximum dollar amount you are prepared to lose if the stop is hit. Your position size follows from that number.
The core calculation is simple:
Position size = maximum dollar risk / risk per unit
If you are buying a stock at $50 with a stop at $48, your risk is $2 per share. If your maximum planned loss is $200, your position size is 100 shares. A move below $48 should cost roughly $200 before slippage and fees.
For forex, futures, options, and crypto, the math changes with contract specifications, leverage, tick value, and funding costs. The principle does not change. You need to know the real cash impact of a stop before entering the position.
Risking a fixed fraction of account equity can help keep losses consistent as your account changes. There is no universal percentage that fits every trader. A newer trader may use a smaller amount while building consistency. An experienced trader may vary risk based on setup quality and portfolio exposure. The key is that the amount is deliberate, not decided after the market moves against you.
Judge the Reward Against the Risk
A trade can have a logical stop and still be a poor opportunity. Next, identify a realistic target based on nearby chart structure.
For a long position, the first major resistance area often provides a practical target. For a short, look toward the next support zone. Do not set targets solely because they create an attractive ratio on paper. Price needs room to move there without running directly into a level where sellers or buyers have repeatedly stepped in.
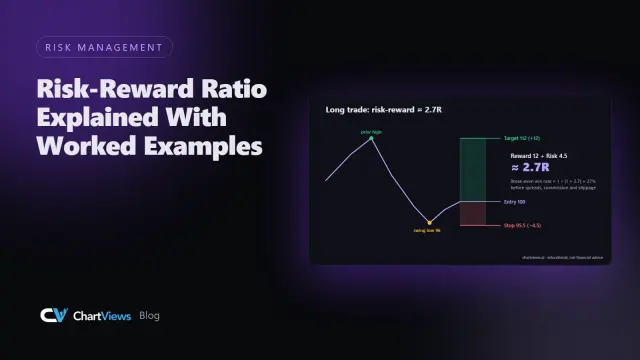
Compare potential reward with the amount at risk. If you risk $200 to make $400, the reward-to-risk ratio is 2:1. That does not guarantee a good trade, but it gives you a measurable framework for evaluating it.
A lower reward-to-risk trade can still make sense when the setup has a high probability of working, such as a trend continuation from a well-tested level. A 3:1 target is not automatically better if it sits beyond several major resistance zones and requires an unlikely move. Risk assessment is always a balance between probability, payoff, and market context.
Check Volatility and Liquidity
Your planned stop may be technically valid but practically weak if the market is moving unusually fast. A stock reacting to earnings, a crypto asset moving during thin weekend liquidity, or a currency pair around a central-bank announcement can travel through normal levels quickly.
Volatility affects stop placement, position size, and expected holding time. When price ranges expand, you may need a wider stop to avoid normal fluctuations. That wider stop should usually lead to a smaller position size if you want to maintain the same dollar risk.
Liquidity is equally important. Wide bid-ask spreads and low trading volume can create slippage, meaning your actual exit is worse than your stop price. This risk is especially relevant for small-cap stocks, thinly traded options, lower-volume crypto tokens, and markets outside peak trading hours.
Before entering, check four practical conditions:
- Is the instrument moving more than usual for its timeframe?
- Is a scheduled event likely to create a sharp price gap or spike?
- Is the bid-ask spread reasonable for the size you plan to trade?
- Can you exit efficiently if the setup fails?
If the answer to the last question is unclear, reduce size or skip the trade. A clean setup in an illiquid market is not the same as a clean setup in a highly liquid one.
Avoid Hidden Correlation Risk
Assessing one trade in isolation can create a false sense of control. If you are long several technology stocks, holding multiple altcoins, or trading currency pairs tied to the same U.S. dollar move, you may have more exposure than your individual stop amounts suggest.
For example, risking 1% on four highly correlated long positions is not always four separate 1% risks. A broad market selloff can trigger all four stops at once. In effect, you may be carrying a concentrated bet on one market outcome.
Review open positions before adding a new trade. Ask whether the new setup diversifies your exposure or adds to the same directional view. Sometimes the disciplined decision is to take the best setup only, rather than every chart that points in the same direction.
Define the Trade Before the Emotion Arrives
The highest-quality risk plan is written before entry, when price is not testing your patience. Record your entry zone, stop level, target area, position size, and the specific condition that would invalidate the idea.
Also decide how you will manage the trade if price moves in your favor. Will you take partial profits at the first resistance level? Will you move your stop only after a new higher low forms? Will you hold the full position until the target? There is no single correct approach, but changing rules mid-trade because of fear or excitement creates inconsistency.
A structured chart review makes this faster. ChartViews AI can help identify trend direction, key support and resistance zones, and potential entry and exit areas from an uploaded chart. Use that analysis as a decision aid, then apply your own position sizing and risk limits before placing the order.
How to Assess Trade Risk in Real Time
Markets do not wait for perfect conditions. Still, a fast review can protect you from impulsive entries. Before you click buy or sell, ask: Where am I wrong? What does that loss cost? Is there enough clear space to my target? Is volatility normal? Does this trade overlap with risk I already hold?
If you cannot answer those questions in seconds, you do not yet have a fully defined trade. Waiting is a position too. It preserves capital for setups where your entry, exit, and exposure are clear.
The goal is not to eliminate losses. Losses are part of trading. The goal is to make every loss known, limited, and acceptable before it happens. That is how disciplined traders stay available for the next high-quality opportunity.
Educational content, not financial advice. Trading involves risk of loss.
 Money Circle Blog
 Trader Reflect Blog