
Everything Inside ChartViews AI
Built for traders who want professional-grade analysis without the noise.
Analyze a chartHow it works
Upload a screenshot
Any platform, market or timeframe.
Read the report
Trend, levels and two scenarios.
Check the plan
See where each idea would be wrong.
Four screens, one flow.
Real screens from the app and the website, in the order you meet them.
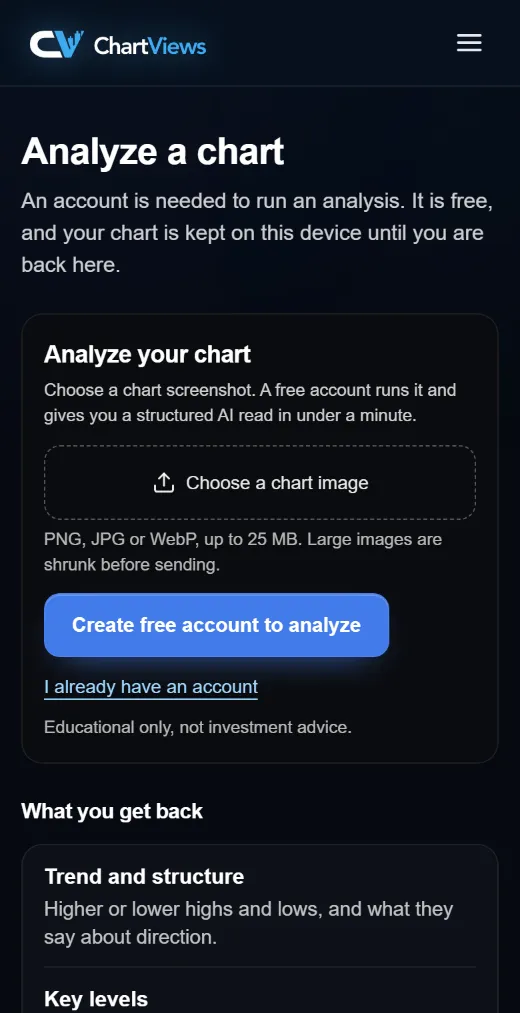
1 · Upload a chart
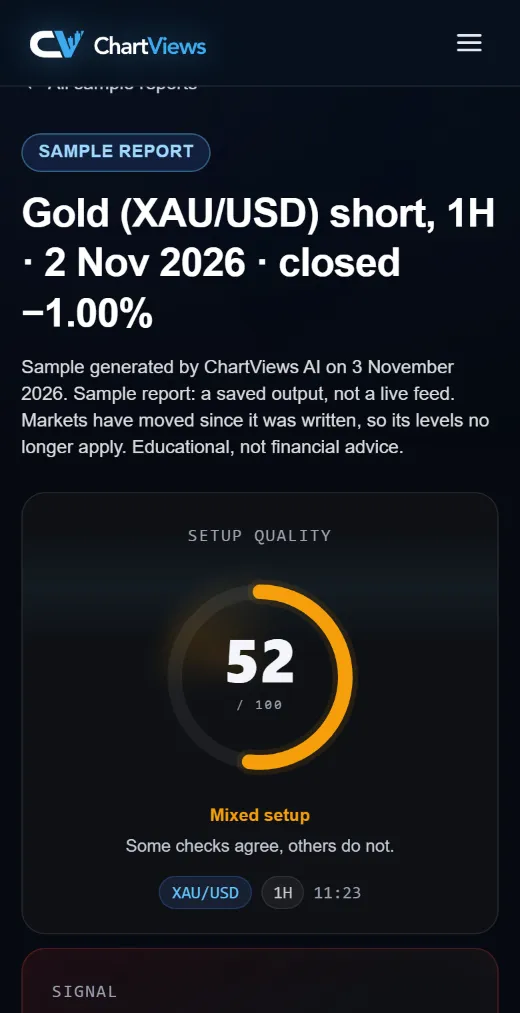
2 · Read the result
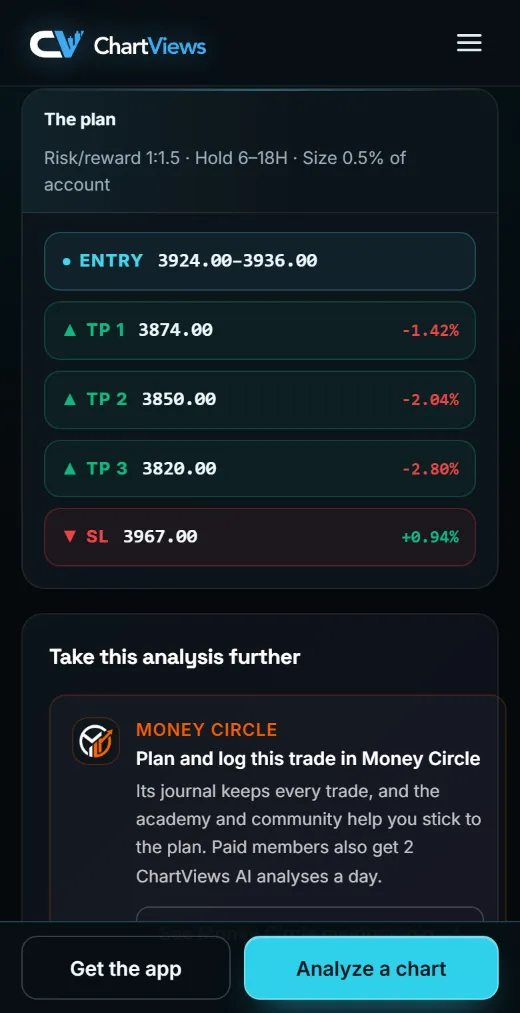
3 · Check the plan
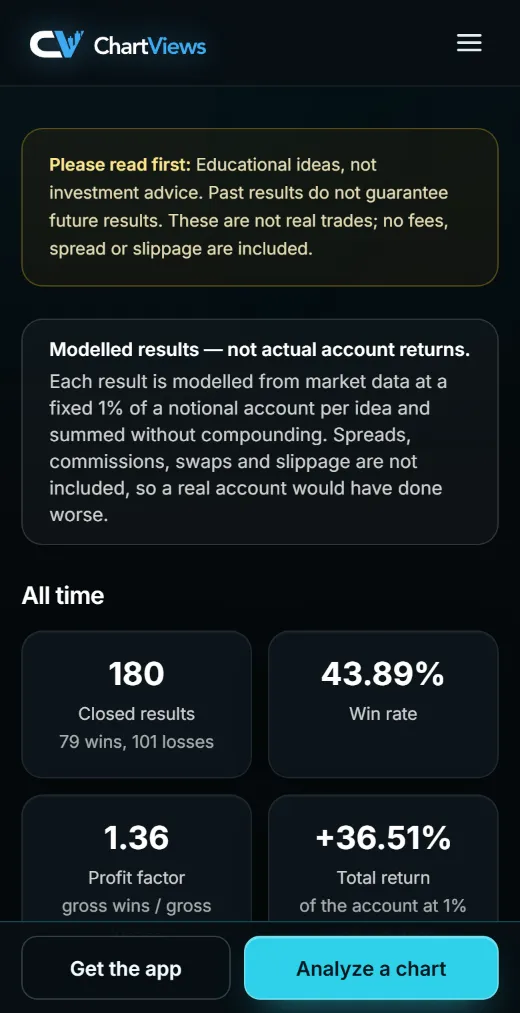
4 · Judge the record
8-Module AI Report
Eight modules covering price action, structure, levels, liquidity, news context and a risk-aware trade plan.
- Price Action
- Market Structure
- Fibonacci
- Bollinger Bands
- Liquidity Zones
- Macro & Fundamentals
- Directional Bias
- Trade Plan & Confidence
Chart Upload Analysis
Upload a screenshot from any charting platform, timeframe or market. If you can see the chart, it can be analysed.
8-Module Report
Every analysis follows the same eight modules, from price action to risk and confidence, so reports are easy to compare.
Consistent Structure
A fixed report format with explicit entry, stop, target and R:R, so you always know where to look.
Direct Subscription
Prefer no broker? Subscribe directly for Lite, Standard, Plus or Unlimited access. See Plans for prices and limits.
Built for one job: reading charts.
Purpose-built for charts
Prompted and structured for one job: reading a chart, finding its structure and mapping the risk. Not a general-purpose chat.
The same 8 modules, every time
Price action, structure, Fibonacci, Bollinger Bands, liquidity, macro context, bias and a trade plan, in one fixed order.
One upload, one report
The full report is built in one go from your screenshot, so you can check a setup while it is still forming. How long it takes varies with load.
Educational by design
Every level, bias and scenario comes with its reason, so you learn to read the chart instead of copying a call.
Why this level? The last swing low held twice and lines up with the 4H demand zone.
Any market you can screenshot
Forex, indices, metals, stocks and futures, from any charting platform and on every common timeframe.
7-day free trial
Up to 3 completed analyses a day for 7 days from verified sign-up. No card required.
How the engine reads a chart.
- 01
Your chart and its context
A screenshot from any platform. Add the asset, timeframe and trading style if the chart does not show them.
- 02
Trend structure
Swings are read as higher or lower highs and lows. That sets the direction the rest of the report works with.
- 03
Levels and liquidity
Support and resistance zones, and the places where stops are likely to sit and get swept.
- 04
Momentum and confluence
Candle behaviour and momentum, plus Fibonacci and Bollinger Bands, to judge whether a move has force behind it.
- 05
Scenarios and risk
A bias, two scenarios, the level that invalidates the idea and a risk-reward plan you can check.
The 8 modules in every report
- 01Price action
- 02Market structure
- 03Fibonacci
- 04Bollinger Bands
- 05Liquidity zones
- 06Macro and fundamentals
- 07Directional bias
- 08Trade plan and confidence
AI can misread a chart. Check each level before you act on it.
Seven days to test it on your charts.
- 1
7 days from verified sign-up
7 × 24 hours from the moment you create your account. Verify your email to run your first analysis.
- 2
3 completed analyses per UTC day
Up to 3 reports a day, each with all 8 modules.
- 3
Failed analyses don't count
If a report cannot be produced, it is not taken from your daily allowance.
- 4
Resets at 00:00 UTC
A new allowance every day at midnight UTC, wherever you are.
- 5
No card required
Nothing to cancel. Pick a plan only if you want to keep going.
A structured report, not a chat reply.
Reading the chart
- ChartViews AI
- Upload a screenshot and get an 8-module report.
- Manual charting
- You read it yourself, with your own method.
- General AI chat
- Can describe an image. The result depends on your prompt and the model.
Report format
- ChartViews AI
- The same 8 modules in the same order, every time.
- Manual charting
- Your own template or notes.
- General AI chat
- Whatever you ask for in each conversation.
Levels and plan
- ChartViews AI
- Entry, stop and targets as educational scenarios, or marked unclear when the chart does not show them.
- Manual charting
- You set and track them.
- General AI chat
- Available if you ask. Check each level against your chart.
Educational use only. Always check every level against your own chart.
Recommend ChartViews. Earn recurring commissions.
Earn a share of every payment your referred members make, for as long as they keep paying. The current rate and the payout rules are on the affiliate page.
- 1Share your linkYour own referral link and dashboard.
- 2Traders subscribeThey sign up through your link and choose a plan.
- 3You earn, recurringA share of every payment, as long as they pay.
From the network
 Money Circle Blog
 Trader Reflect Blog
Ready to Analyze Your First Chart?
Upload any chart and get a structured 8-module AI analysis. 7-day free trial, up to 3 completed analyses a day, no card required.
Analyze a chart