Can AI Analyze Stock Charts Well?
A chart can look obvious after the move. Before the move, it is usually a mess of competing signals, false breaks, and second-guessing. That is why so many traders ask, can AI analyze stock charts in a way that actually improves decisions rather than just adding more noise?
The short answer is yes, but only if you understand what AI is doing well, where it can misread context, and how to use it as decision support instead of blind authority. For active traders, that distinction matters. Speed is useful. Structured analysis is useful. But the edge comes from using both without giving up judgment.
Can AI analyze stock charts better than a human?
In some tasks, yes. In others, not consistently.
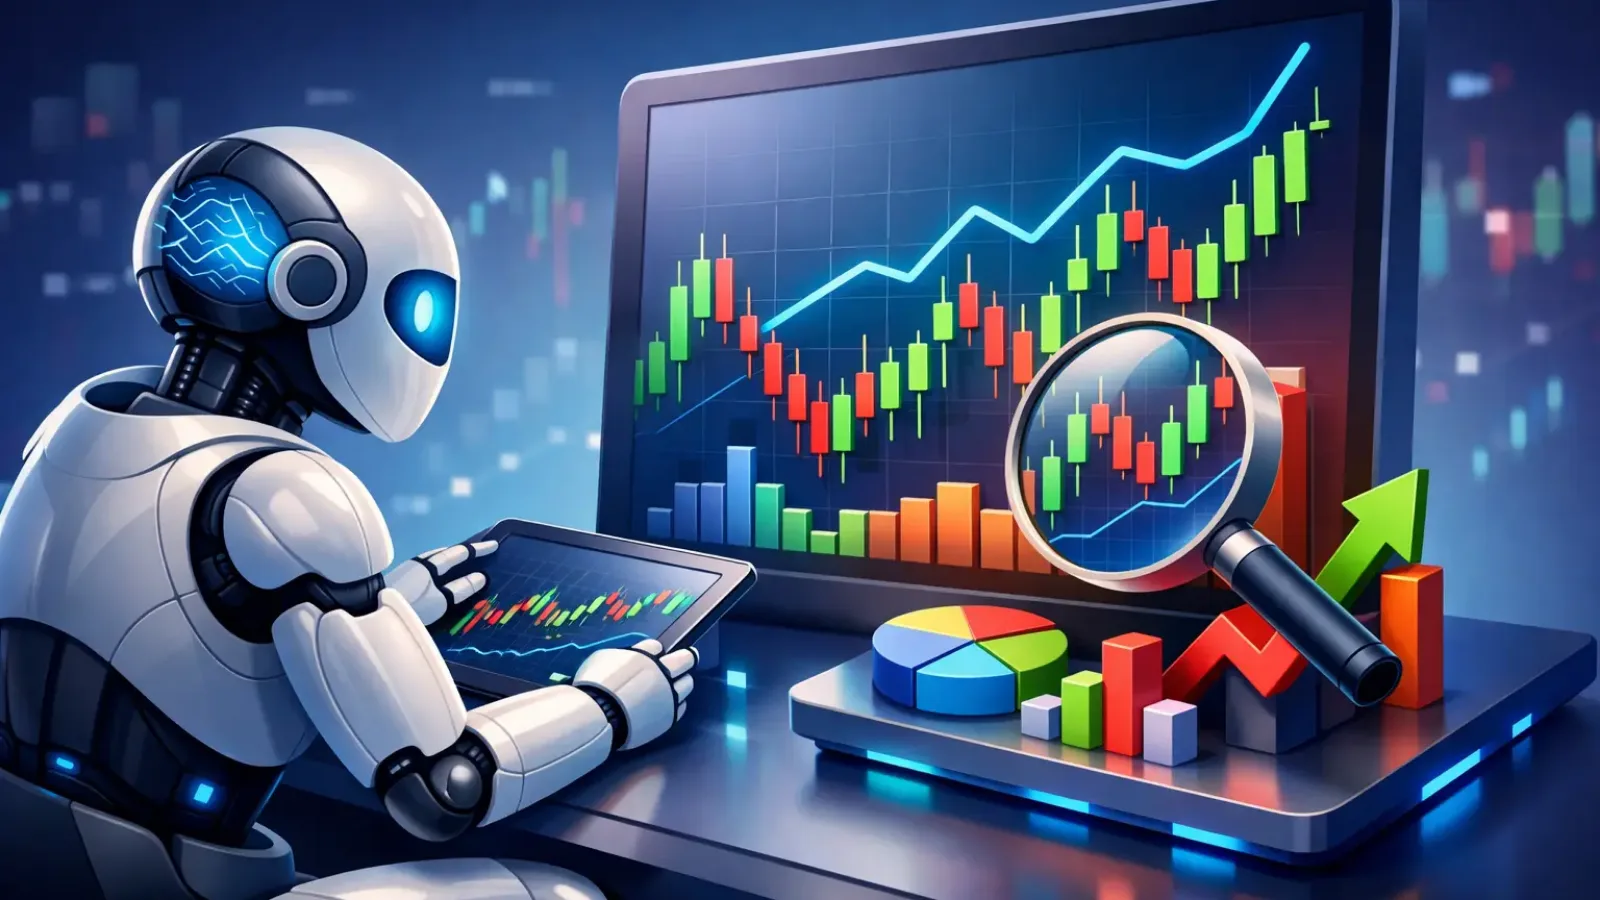
AI is strong at processing visual and numerical patterns at scale. Give it a chart, and it can quickly identify trend direction, momentum shifts, support and resistance zones, breakout structures, and possible entry or exit areas. It does this without fatigue, hesitation, or the emotional bias that causes traders to see what they want to see.
That makes AI especially useful when you are scanning multiple setups or reviewing charts under time pressure. A human trader might miss a repeated rejection zone on the one-hour chart because they are focused on the latest candle. AI can flag that level instantly and present it as part of a structured read.
But better does not always mean smarter. Human traders still outperform AI in areas where context matters more than pattern recognition alone. A chart setup ahead of earnings, a market reacting to a macro headline, or a low-volume move in a thinly traded stock may require judgment beyond what a chart image can show. AI can detect structure. It cannot always understand why the market is behaving that way unless it is built with broader context and the user interprets the output correctly.
So the practical answer is this: AI often analyzes stock charts faster and more consistently than a human, but the best results come when traders use that analysis to sharpen decisions, not outsource them completely.
What AI sees in a stock chart
When traders hear AI chart analysis, they sometimes imagine a black box making random predictions. That is not how serious tools work.
AI can break a chart into recognizable technical components. It can detect trend direction by reading price structure, moving behavior, and relative positioning over time. It can estimate support and resistance by identifying repeated reaction zones where price has stalled, reversed, or accelerated. It can also interpret common formations such as consolidations, breakouts, retests, and range-bound movement.
More importantly, it can organize that information into something usable. Instead of forcing you to manually inspect every swing high and low, AI can present a cleaner summary of what matters now: where price is trending, where key levels sit, and where the chart may offer higher-probability entries or exits.
For many retail traders, that solves a real problem. The issue is not access to charts. It is turning raw charts into disciplined analysis quickly enough to act.
Where AI chart analysis actually helps traders
The biggest advantage is speed with structure.
If you trade several markets or timeframes, manual analysis becomes inconsistent fast. One chart gets a careful review. The next gets a rushed glance. By the time you are on chart six, your standards have slipped. AI helps standardize the process. It can review each chart with the same logic, flagging levels and patterns using a repeatable framework.
That repeatability matters because many trading mistakes are not caused by lack of knowledge. They are caused by inconsistency. Traders know they should wait for confirmation, respect resistance, or avoid chasing extended moves. Then the session gets busy and discipline disappears. AI can act as a fast second set of eyes that brings the chart back to structure.
It also helps with analysis paralysis. When too many possible interpretations are on the screen, traders freeze. An AI-generated read can narrow the field by highlighting the dominant trend, the nearest major zones, and the more logical trade paths. That does not remove discretion, but it reduces noise.
This is where a platform like ChartViews AI fits naturally. The value is not replacing the trader. The value is cutting the time between chart upload and actionable technical insight.
Where AI gets stock charts wrong
AI is not immune to bad inputs or bad market conditions.
If the chart is unclear, compressed poorly, or missing useful timeframe context, the analysis can suffer. If the market is choppy and directionless, AI may still identify levels accurately but struggle to produce high-conviction trade logic because the chart itself does not support it. Garbage in still leads to weaker output.
There is also the issue of regime change. A chart may look technically clean until a sudden catalyst changes the entire setup. News, earnings, rate decisions, and broad risk-off conditions can invalidate a technically sound pattern in minutes. AI can analyze the chart in front of it. It cannot guarantee that the next candle will respect the setup.
Another trade-off is overreliance. Traders who treat AI analysis as a signal service rather than a decision-support tool usually hit a wall. Good AI can improve chart reading. It cannot remove the need for risk management, position sizing, or patience.
Can AI analyze stock charts for beginners?
Yes, and this may be one of the strongest use cases.
Beginners often struggle with the same core tasks: identifying trend direction, drawing support and resistance consistently, and deciding whether a setup is worth watching at all. AI can shorten that learning curve by showing a structured interpretation of the chart right away.
That matters because most beginners do not need more indicators. They need clearer process. When AI points out trend bias, key zones, and possible entry or exit logic, it helps newer traders connect visual price action with actual trading decisions.
There is still a catch. Beginners should use AI to learn disciplined chart review, not to avoid learning it. If you never understand why a level matters or why a trend is weakening, your results will remain fragile. The best outcome is using AI as guided repetition. Over time, you start seeing the same structures yourself, faster and with more confidence.
What to look for in an AI stock chart analysis tool
Not all AI chart tools are built for traders who need practical output.
The useful ones are clear, fast, and specific. They do more than label a market as bullish or bearish. They identify support and resistance zones, trend direction, and likely trade areas in a way that helps execution. They should reduce interpretation time, not replace one vague opinion with another.
You also want a tool that matches how traders actually work. Upload the chart, get an immediate read, and move on to the decision. If the workflow is slow or the analysis is generic, the tool adds friction instead of removing it.
Accuracy matters, but usability matters too. A technically sophisticated model is less valuable if the output is too abstract to act on. Traders need analysis they can apply inside a real session, under real time pressure.
The real answer to can AI analyze stock charts
Yes, AI can analyze stock charts, and in many cases it can do it faster, more consistently, and with less bias than a manual review. That is the upside.
The limit is that charts do not exist in a vacuum. AI can identify structure, trend, and levels with impressive efficiency, but traders still need to weigh context, catalysts, and risk. The strongest workflow is not human versus AI. It is human judgment supported by instant, structured chart analysis.
If your current process involves staring at charts too long, doubting your levels, or missing setups because review takes too much time, AI is not just a convenience. It is a way to make your chart work more disciplined and repeatable.
And that is where the real edge starts - not with prediction, but with clearer decisions made faster.
Educational content, not financial advice. Trading involves risk of loss.
 Money Circle Blog

 Trader Reflect Blog