Support and Resistance: How to Draw Levels That Matter
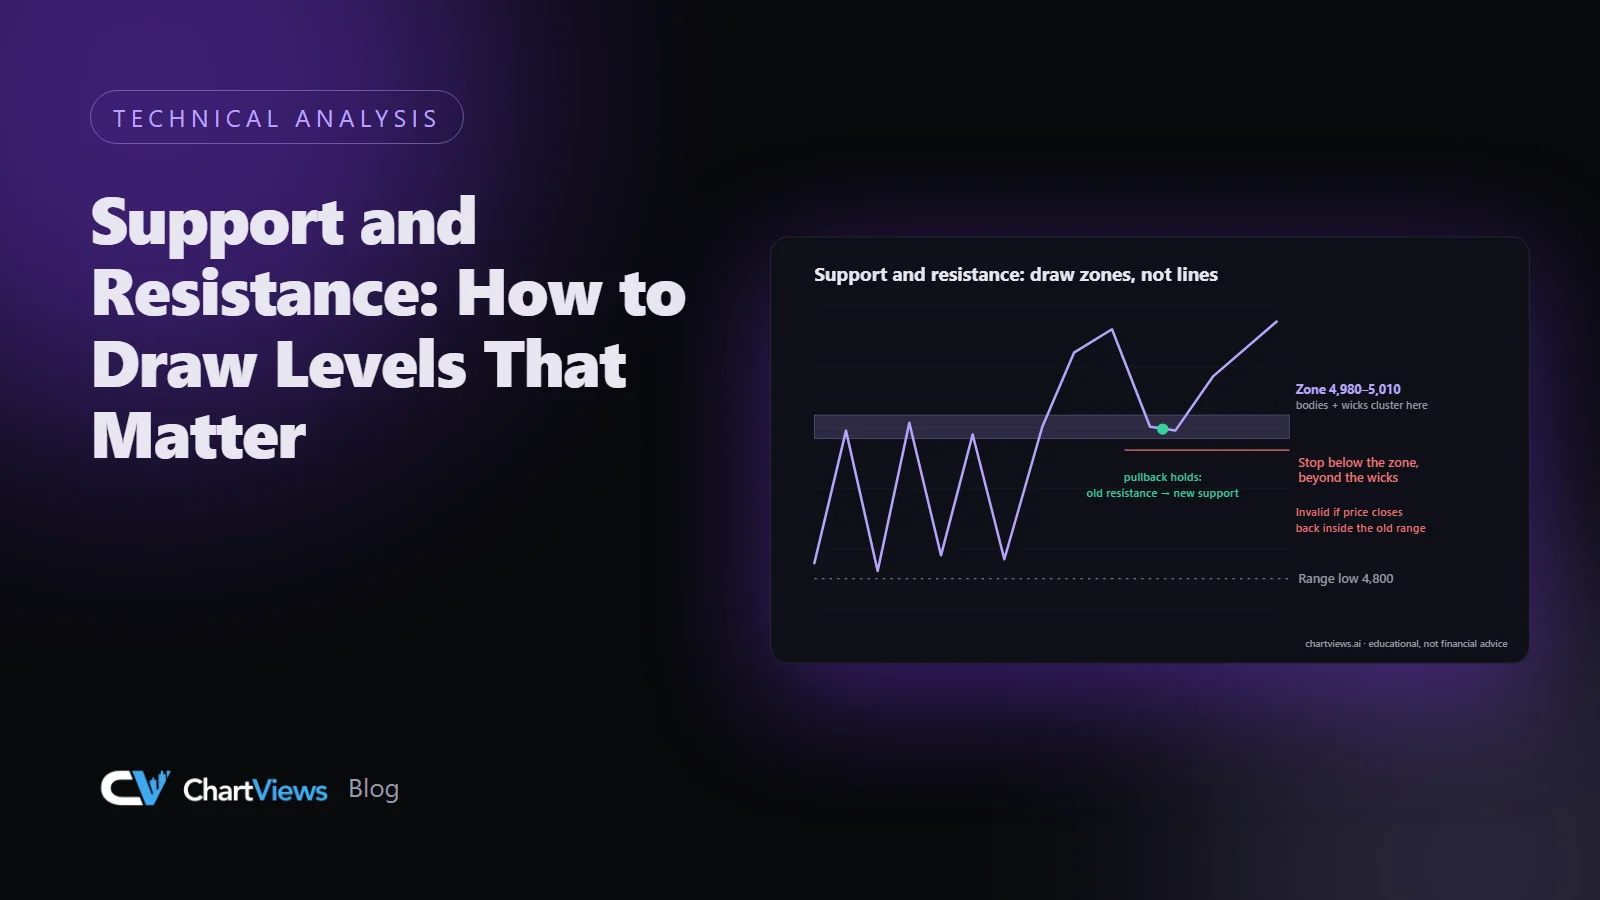
Open any chart and it is easy to draw twenty horizontal lines that all look reasonable in hindsight. The skill is drawing the few that will matter in the future. This guide covers what support and resistance really are, how to draw them as zones, how to rank them, and how to avoid the most common mistakes.
What support and resistance are
Support is a price area where buying interest has previously been strong enough to stop or reverse a decline. Resistance is an area where selling interest has previously been strong enough to stop or reverse a rise. Neither is a guarantee. They are places where the market has shown a reaction before, which makes them natural places to plan around.
A useful way to think about it: a level matters because many participants remember it. Traders who missed a move, bought too early, or were trapped at a turning point all have orders and opinions anchored to that price.
Draw zones, not razor-thin lines
Price rarely turns at an exact number. Candle wicks poke through, closes land slightly above or below, and different data feeds disagree by a few ticks. A level is better drawn as a band.
A practical method:
- Mark the swing high or swing low that created the reaction.
- Look at where candle bodies clustered near that area, and where only wicks reached.
- Draw a band from roughly the body cluster to the extreme of the wicks.
- Keep the band as tight as the evidence allows. A band that covers a third of the chart is no longer a level.
Using zones also helps with stop placement. A stop sitting exactly on a line is exposed to the very sweeps that those lines attract.
What makes a level matter
Not every turning point deserves a line. These factors raise the importance of a level:
- Multiple touches. Two or three clear reactions beat a single one, though many touches can also weaken a level because the orders resting there get used up.
- Higher timeframe origin. A daily or weekly level outranks an hourly one. Draw the higher-timeframe levels first and then drop down.
- Sharp reversal. A level where price left quickly and with strong candles shows decisive participation.
- Role reversal. Broken resistance that becomes support, or the other way around, is one of the most widely watched behaviours on any chart.
- Round numbers and prior extremes. Whole numbers, previous year highs and lows, and psychological thresholds attract attention from many market participants.
- Confluence. A level that lines up with a trendline, a Fibonacci retracement or a moving average gives more reasons to pay attention.
A step by step routine
Work from the largest timeframe to the smallest so you do not clutter the chart.
- On the weekly or daily chart, mark the obvious major highs and lows and the zones where price spent a long time.
- Move to your trading timeframe, for instance the four-hour chart, and add the nearest zones above and below the current price.
- Delete anything that is not near the current price or that has no clear reaction behind it.
- Number the remaining zones by importance. You should end up with perhaps three to six, not twenty.
Worked example, described in words
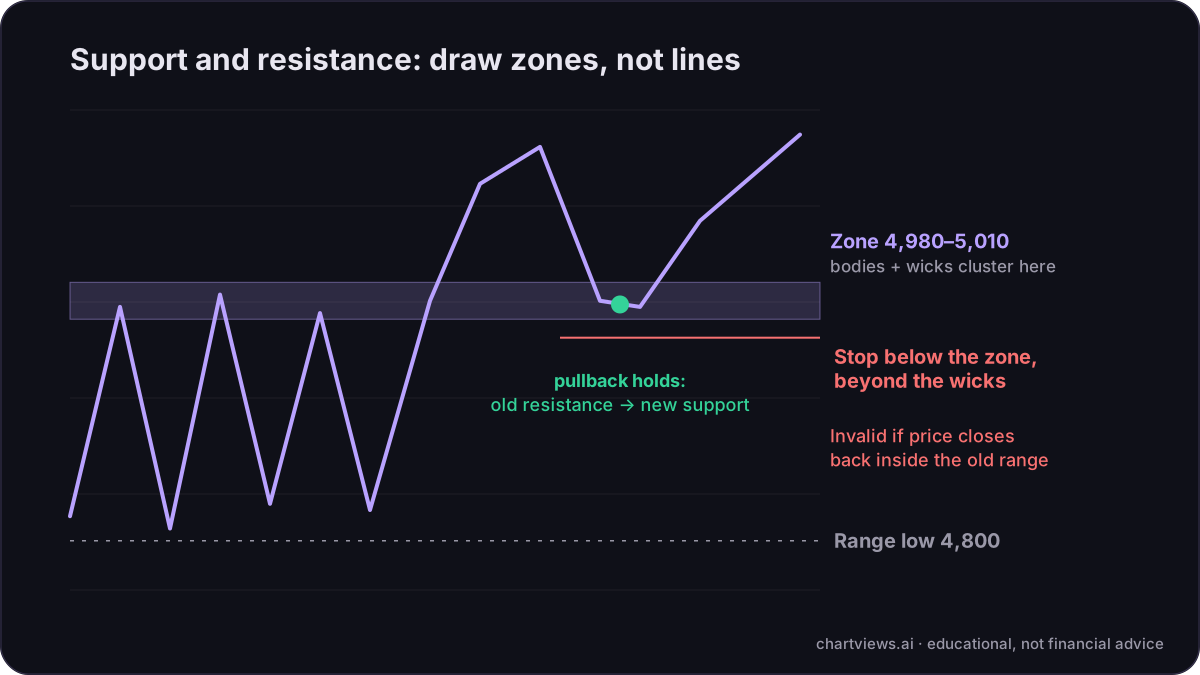
Imagine an index that spent several weeks ranging between 4,800 and 5,000 before breaking above. On the daily chart, the area between 4,980 and 5,010 shows many candle bodies and several wicks, so you draw a zone there instead of a line at 5,000. Price breaks above, pulls back into that zone, and holds it with a strong bullish candle. This is a role reversal: old resistance acting as new support. A trader who planned a long idea there would place the stop below the zone, beyond the wicks, and set a first target at the next higher-timeframe resistance. If instead price closes decisively back inside the old range, the idea is invalidated, and the level that mattered has failed.
How levels fail
Levels do not hold forever. Signs that a level is weakening or has failed:
- Price closes beyond it on the timeframe you are trading, not just a wick through it.
- Retests of the level become weaker and shorter each time.
- The break is followed by momentum rather than an immediate return.
A wick beyond a level that quickly returns is often a liquidity sweep rather than a real break. Distinguishing the two comes down to the close and to what price does in the next few candles.
Common mistakes
- Too many lines. If everything is a level, nothing is.
- Fitting lines to hindsight. Draw levels using only information that was available before the move you are studying.
- Using only one timeframe. A beautiful four-hour level can sit directly under a major daily resistance.
- Treating levels as certainties. Every level is a probability, not a wall.
- Ignoring context. In a strong trend, support is often broken shallowly and resistance is often pushed through. Check market structure before you assume a reversal.
Putting levels to work
Levels are most useful for three things: deciding where a trade idea becomes invalid, finding realistic targets, and avoiding entries right into a nearby barrier. If the nearest resistance is only a small distance above your entry, the risk-reward may not justify the trade, however good the setup looks.
An AI chart analysis report marks these zones automatically alongside structure, liquidity and Fibonacci confluence, so you can compare them with your own drawing. You can try that on your own chart with a free analysis: see your chart analysed.
Educational content, not financial advice. Trading involves risk of loss.
 Money Circle Blog
 Trader Reflect Blog