Risk-Reward Ratio Explained With Worked Examples
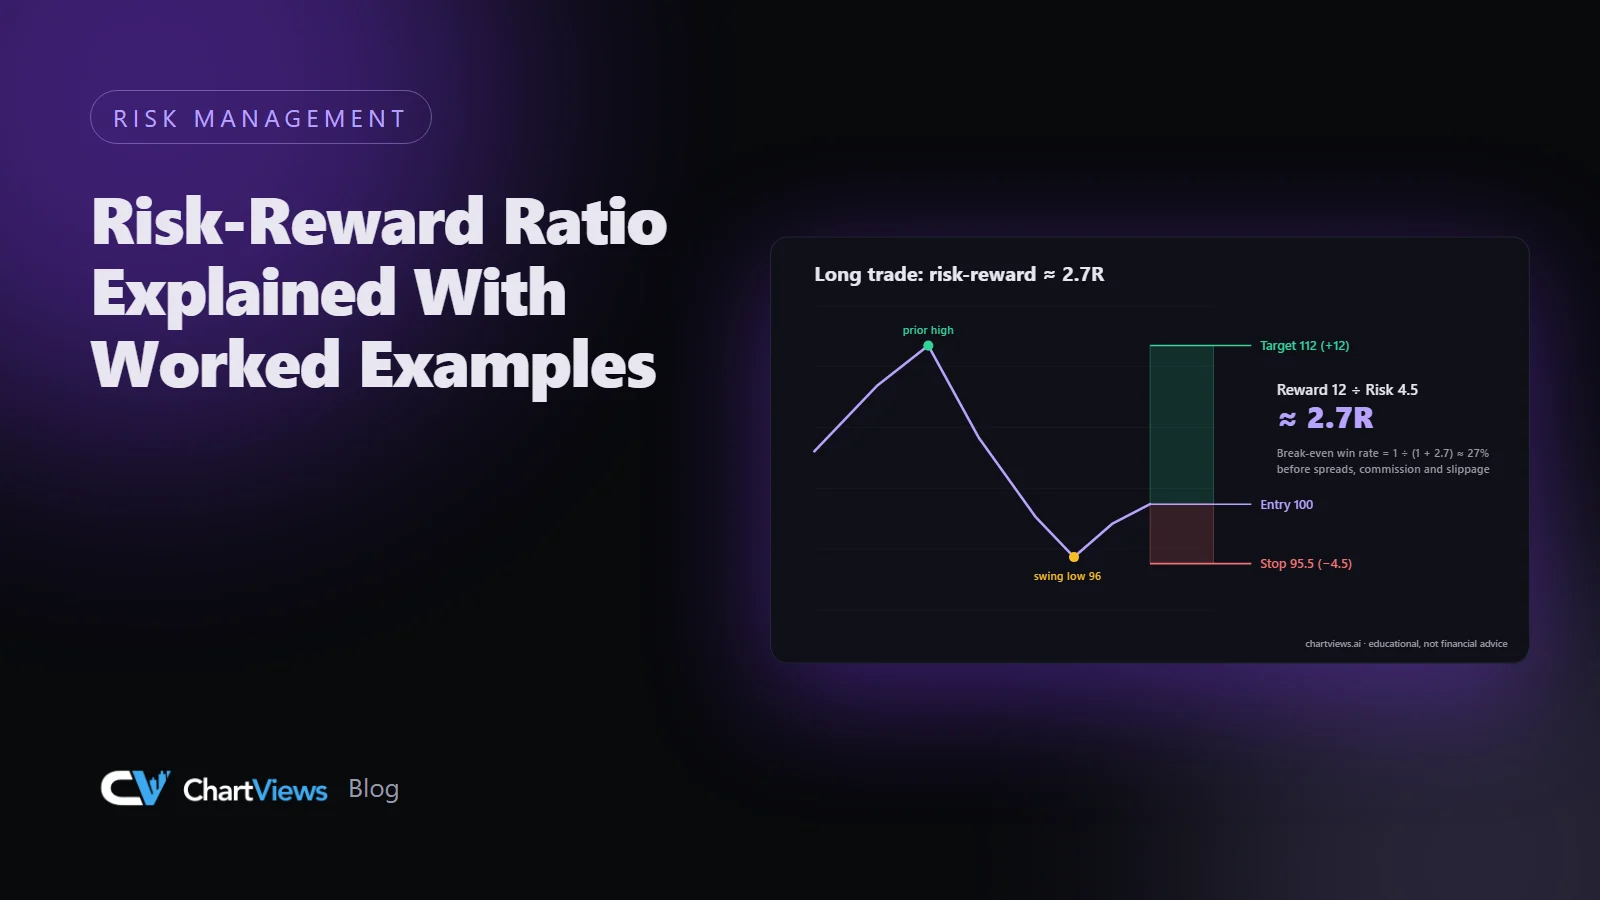
Almost every trading course mentions the risk-reward ratio, and almost every beginner misuses it. The ratio is simple arithmetic, but what it means for your results depends on a second number that is often ignored. This article explains how to calculate it, how to read it, and how it fits into a plan.
What risk-reward means
The risk-reward ratio (often written R:R) compares what you stand to lose if a trade fails with what you stand to gain if it works. The loss is measured from your entry to your stop-loss. The gain is measured from your entry to your target.
- Risk = distance from entry to stop-loss
- Reward = distance from entry to target
- R:R = reward divided by risk
If you risk 50 points to make 100 points, the ratio is 1:2, usually described as "two R". The "R" is a handy unit: one R is whatever you risk on the trade. A trade that makes twice your risk is a +2R trade; a stopped-out trade is a -1R trade.
Worked example: a long trade
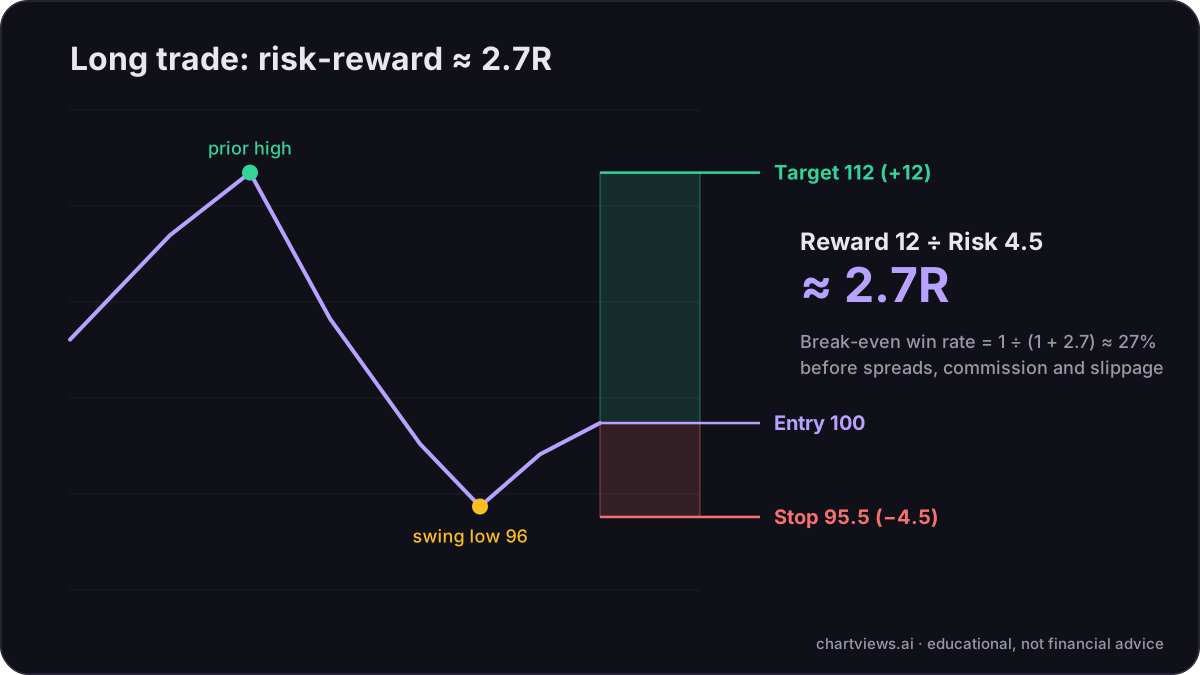
Suppose a stock trades at 100 and you think it can rise toward a prior high at 112. The chart shows a swing low at 96, and a close below it would mean the idea is wrong, so you place the stop at 95.5.
- Entry: 100
- Stop: 95.5, so risk is 4.5
- Target: 112, so reward is 12
- R:R = 12 / 4.5, about 2.7
On paper that is an attractive ratio. But the ratio alone says nothing about how likely the target is to be reached. That is the next piece.
The hit rate that goes with it
R:R only makes sense together with the percentage of trades that reach their target, often called the win rate or hit rate. The break-even relationship is straightforward:
- With an R:R of 1:1, you need to win more than 50 percent of trades to break even, before costs.
- With 1:2, you need to win more than about 33 percent.
- With 1:3, you need to win more than 25 percent.
The formula is break-even win rate = 1 / (1 + R:R). These figures ignore spreads, commissions and slippage, which push the real break-even higher.
This is why a high ratio is not automatically good. A target placed very far away might offer 1:5 on paper, but if price reaches it only rarely, the trade can still lose money over time. And a very small target with a wide stop can look comfortable on hit rate but demand an unrealistically high win rate to survive costs.
How to set the numbers honestly
Beginners often work backwards: they pick the ratio they want and then draw the stop and target to fit. Do it in the opposite order.
- Find the invalidation level first. That is where the stop belongs (see the article on invalidation).
- Identify realistic targets from the chart: a prior swing high, a resistance zone, a range boundary.
- Measure the ratio that results.
- If the ratio is too low, the correct response is usually to skip the trade or wait for a better entry, not to move the stop.
Costs change the ratio
The quoted ratio is before costs. Suppose the spread plus commission costs 0.5 points on a trade risking 4.5 points. Your effective risk is 5, and your effective reward is 11.5, so the real ratio is 2.3 rather than 2.7. On small stops, costs matter a lot. A tight stop on a volatile instrument may look like a good ratio and still be eaten by noise and fees.
Multiple targets and partial exits
Many traders scale out: take part of the position at a first target and leave the rest to run, often moving the stop to the entry afterwards. The blended ratio then depends on how much you close at each level. For example, closing half at 1R and half at 3R gives an average of 2R if both targets are hit, but if price reverses after the first target and the stop at entry is triggered, the whole trade returns only 0.5R. Work out these scenarios before entering, so the plan is not invented in the heat of the moment.
Common misconceptions
- A higher ratio is always better. Only if the target remains realistic.
- Risk-reward guarantees profit. It does not. It is a way to describe a trade, not a promise.
- You must always take 1:2 or better. A minimum is a personal rule. Some strategies work with lower ratios and a very high hit rate; others run at lower hit rates with large ratios.
- Moving the stop closer improves the ratio. It improves the number while increasing the chance of being stopped by normal noise.
Using R:R in practice
A practical routine is to write down, before each trade, the entry, stop, target, ratio and the amount of account you are risking. After a series of trades, review them in R terms rather than in currency: how many R did the winners make, how many R did the losers lose, and how often did price actually reach the targets you set? That record is far more informative than any single trade.
An AI analysis report includes a risk-reward figure inside its trade plan, together with the entry, stop and targets. Treat it as a starting point and check it against your own rules and the costs of your broker. You can run a free analysis to see how the numbers are laid out: try a free analysis.
Educational content, not financial advice. Trading involves risk of loss.

 Money Circle Blog

 Trader Reflect Blog