How to Set Stop Loss Levels Without Guesswork

A stop loss is not a prediction that your trade will fail. It is the price where your original trade idea is no longer valid. Learning how to set stop loss levels starts there: define what must remain true for the setup to work, then place the exit beyond the point that proves you are wrong.
That distinction matters. Many traders choose a stop based on what dollar amount feels tolerable, then discover normal market noise takes them out before the move develops. Strong risk control works in the opposite direction. Read the chart first, identify the invalidation level, then adjust position size so the dollar risk fits your plan.
Start With Trade Invalidation, Not a Fixed Percentage
A fixed 2% or 5% stop can be simple, but it ignores the chart. A 2% move may be a major break on a low-volatility stock and barely noticeable on a volatile crypto pair. The same percentage cannot correctly reflect every market, timeframe, or setup.
For a long trade, ask one direct question: where would price need to trade for the bullish setup to be invalid? The answer is often below a meaningful support level, a recent swing low, a breakout base, or the low of a signal candle. For a short trade, reverse the logic. The stop belongs above the resistance level or swing high that would invalidate the bearish thesis.
The key word is meaningful. Placing a stop one cent below a random candle low is not technical analysis. The level should represent structure that other participants can see and react to.
How to Set Stop Loss Using Chart Structure
Chart structure provides the clearest starting point because it ties risk directly to the reason for entering. A trader buying a pullback in an uptrend may place a stop below the most recent higher low. If that low breaks decisively, the trend structure that supported the entry has weakened or failed.
A breakout trader has a different reference point. If price breaks above a well-defined resistance zone, then quickly falls back through that zone and holds below it, the breakout may be failing. The stop can sit below the breakout level, with enough room to account for a routine retest.
Support and resistance are zones, not exact numbers. Price may briefly trade through a level, trigger liquidity, and reverse. That is why stops placed exactly at obvious support or resistance often get hit. Build a small buffer beyond the level rather than placing the order directly on it.
The right buffer depends on the asset and timeframe. A few cents may be reasonable for a liquid, low-priced stock on a short timeframe. It may be irrelevant for Bitcoin, an index future, or a fast-moving forex pair. Look at recent candle ranges and the instrument's typical movement before deciding how much room the setup needs.
Use Closing Prices When the Setup Depends on a Close
Not every breach is a valid breakdown. If your trade thesis is based on a daily close above resistance, it may be logical to exit only after a daily close back below that level. This can reduce exits caused by intraday wicks.
The trade-off is larger potential loss. Waiting for a close gives price more room, but it can also allow a failed trade to move farther against you. This approach works best when position size is reduced to account for the wider stop and when the strategy has been tested across similar setups.
Account for Volatility Before Placing the Order
A structurally correct stop can still be too tight if the market normally swings beyond it. Volatility determines how much movement is ordinary before the chart has actually changed.
One practical method is to compare the distance from entry to stop with the Average True Range, or ATR. If a stock regularly moves $2 per day and your stop is only $0.25 from entry, you are likely risking normal noise rather than a genuine invalidation. Conversely, a stop that is several ATRs away may be so wide that it creates poor reward-to-risk potential.
There is no universal ATR multiple. Short-term traders may work with tighter volatility allowances than swing traders, while a position held through earnings, economic releases, or major crypto events may need substantially more room. The decision depends on your timeframe, the catalyst risk, and whether you are prepared to hold through volatility.
Avoid setting stops immediately before known high-impact events unless that event risk is part of the plan. During earnings or major news releases, price can gap through a stop. Your order may execute well beyond the stop price, especially in thin liquidity or fast markets.
Position Size Makes the Stop Affordable
This is where disciplined traders separate analysis from emotion. You do not move a stop closer just because the proper structural stop risks too much money. You reduce the number of shares, contracts, or units.
The basic calculation is straightforward:
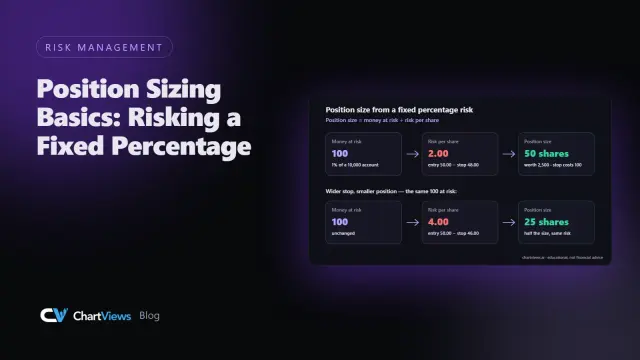
Position size = maximum dollar risk / risk per unit
If your account rules allow a maximum loss of $200 on a trade and the distance from entry to stop is $2 per share, the maximum position is 100 shares. If the chart requires a $4 stop, the position falls to 50 shares.
This approach lets the chart determine the stop and lets your risk limit determine the size. It also prevents a common mistake: taking the same position size in every trade even when one setup needs a much wider stop than another.
Before entering, calculate the likely loss at the stop, including commissions, spread, and possible slippage. For leveraged products, account for the value of each point or pip rather than relying on the price chart alone. A small move in the wrong direction can carry a much larger dollar impact than expected.
Choose the Right Stop Order Type
A stop-market order is designed to trigger a market order once the stop price is reached. Its main advantage is a higher likelihood of exiting the position. Its weakness is execution price uncertainty. In a fast selloff or overnight gap, the fill can be materially worse than the stop level.
A stop-limit order triggers a limit order, giving you more control over the minimum acceptable sale price for a long position or maximum buyback price for a short position. But it may not fill at all if price moves rapidly beyond the limit. That can leave you holding a losing position while the market continues moving against you.
For traders using stops primarily to cap downside, the certainty of getting out is often more valuable than exact price control. Still, the best choice depends on the liquidity of the asset, market conditions, and your broker's order handling. Know how your platform treats stop orders before relying on them in a live trade.
Do Not Move a Stop Farther Away to Avoid Taking a Loss
Moving a stop to reduce risk is one thing. Moving it farther away because you do not want to admit the trade is wrong is another. The second behavior converts a planned loss into an open-ended decision.
There are valid reasons to adjust a stop. After a trade moves decisively in your favor, you might raise a long stop beneath a new higher low to protect part of the gain. You may also use a trailing stop that follows price by a defined amount or percentage. Trailing stops can protect gains during strong trends, but they can also exit you early in a choppy market.
Do not automatically move a stop to breakeven after a small gain. Breakeven feels safe, yet it may sit inside normal volatility and cut off a trade that has not had enough time to develop. Move it only when the chart provides a new structural reason to do so.
Build a Repeatable Stop-Loss Process
Consistency matters more than finding a perfect stop. Before placing any order, review the same core decisions: identify the setup, mark the invalidation level, add a volatility buffer, calculate position size, and define the order type. Then set the stop when you enter, not after price begins moving against you.
A chart review tool can make this process faster by helping you identify trend direction, support, resistance, and potential entry and exit zones. ChartViews AI can provide an instant second read of those levels, but the final stop still needs to match your timeframe, risk limit, and trade thesis.
Keep a record of stopped-out trades. Review whether the level was structurally sound, whether volatility was underestimated, and whether the entry itself was late or low quality. If stops are repeatedly hit before price reaches your target, the answer is not always wider stops. It may be better entries, lower position size, a different timeframe, or avoiding weak market conditions.
A well-placed stop loss does not guarantee a small loss on every trade. Gaps and slippage are real. What it does provide is a defined decision before emotion, speed, and hope take control. Set the level where the chart invalidates the trade, size the position around that risk, and let every exit become part of a repeatable process.
Educational content, not financial advice. Trading involves risk of loss.
 Money Circle Blog
 Trader Reflect Blog