Asking ChatGPT About a Chart vs a Structured Analysis Tool
Many traders now paste a chart screenshot into a general-purpose chatbot and ask, "What do you think?" It is a reasonable thing to try, and for some purposes it works. A purpose-built analysis tool takes a different approach. This article compares the two fairly, so you can decide which fits which job.
What a general chatbot does well
A general assistant such as ChatGPT is flexible. You can ask it follow-up questions, have it explain a concept in simpler terms, or discuss a trading idea in conversation. For learning, it is genuinely useful: ask it what a double top is, how a Bollinger Band squeeze is usually interpreted, or to quiz you on market structure.
It can also describe what it sees in a screenshot, such as the general trend, a visible pattern or nearby swing points, especially when the image is clear and you tell it the symbol and timeframe.
Where the limits show up
The same flexibility creates some practical problems when the goal is a repeatable trade plan:
- Inconsistent format. Ask the same question twice and you may get different structures, different levels and different emphasis. That makes it hard to compare charts or to review your own results over time.
- Missing context. A screenshot may not show the exact price scale, the symbol or the time zone. A chatbot may misread axis values or guess levels, and it typically cannot check live data or an economic calendar unless you provide it.
- Unprompted gaps. If you do not ask about liquidity, volatility or macro events, you will not necessarily get them. The quality of the answer depends heavily on how well you prompt.
- Confident tone. Chat answers read fluently even when a level is only roughly right. You still need to verify numbers against the chart.
- No stop and sizing discipline by default. Unless you ask, you may get a direction and a target but no invalidation level or risk-reward figure.
What a structured tool does differently
A structured analysis tool runs the same checklist on every chart. ChartViews AI, for example, produces a report with eight modules: Price Action, Market Structure, Fibonacci, Bollinger Bands, Liquidity Zones, Macro & Fundamentals, Directional Bias and a Trade Plan & Confidence section with entry, stop-loss, targets and risk-reward. (See our guide on how to read the report.)
The advantages are mostly about process:
- Same format every time, so you can compare two charts side by side or review a month of reports.
- Every question is asked by default. You do not have to remember to ask about liquidity or timing risk.
- Explicit trade plan fields, which makes it easier to check the stop against structure and to size the position.
- A defined wait outcome. A good structured report can say there is no clear edge rather than inventing one.
Side by side
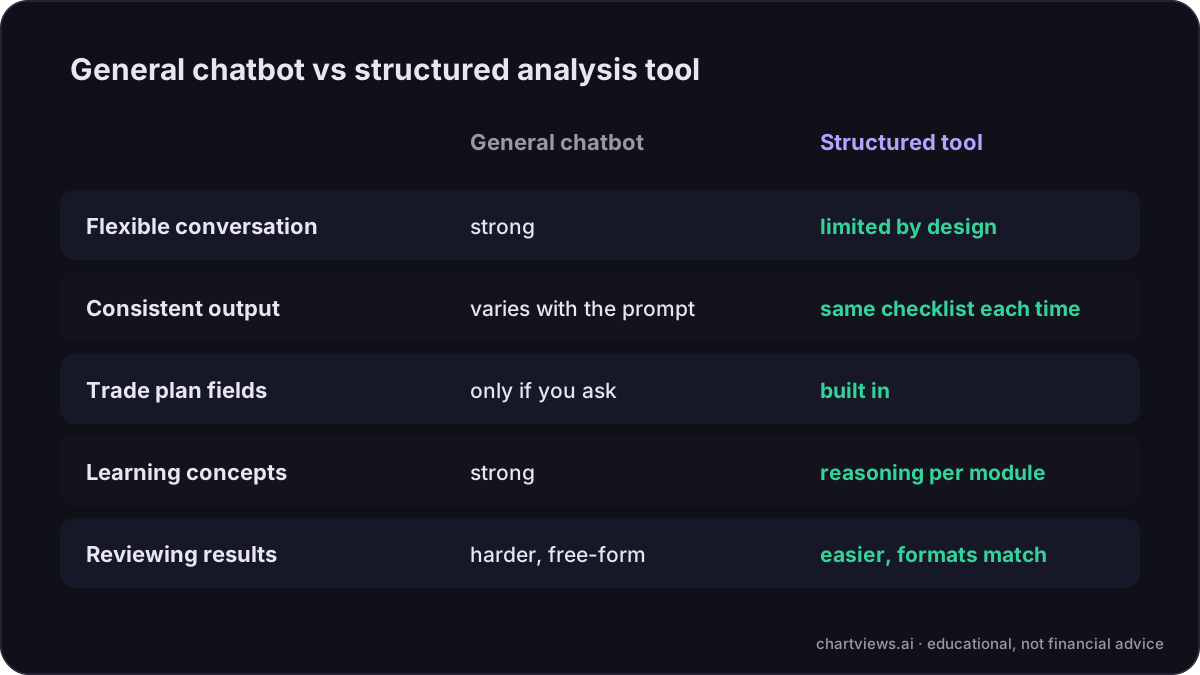
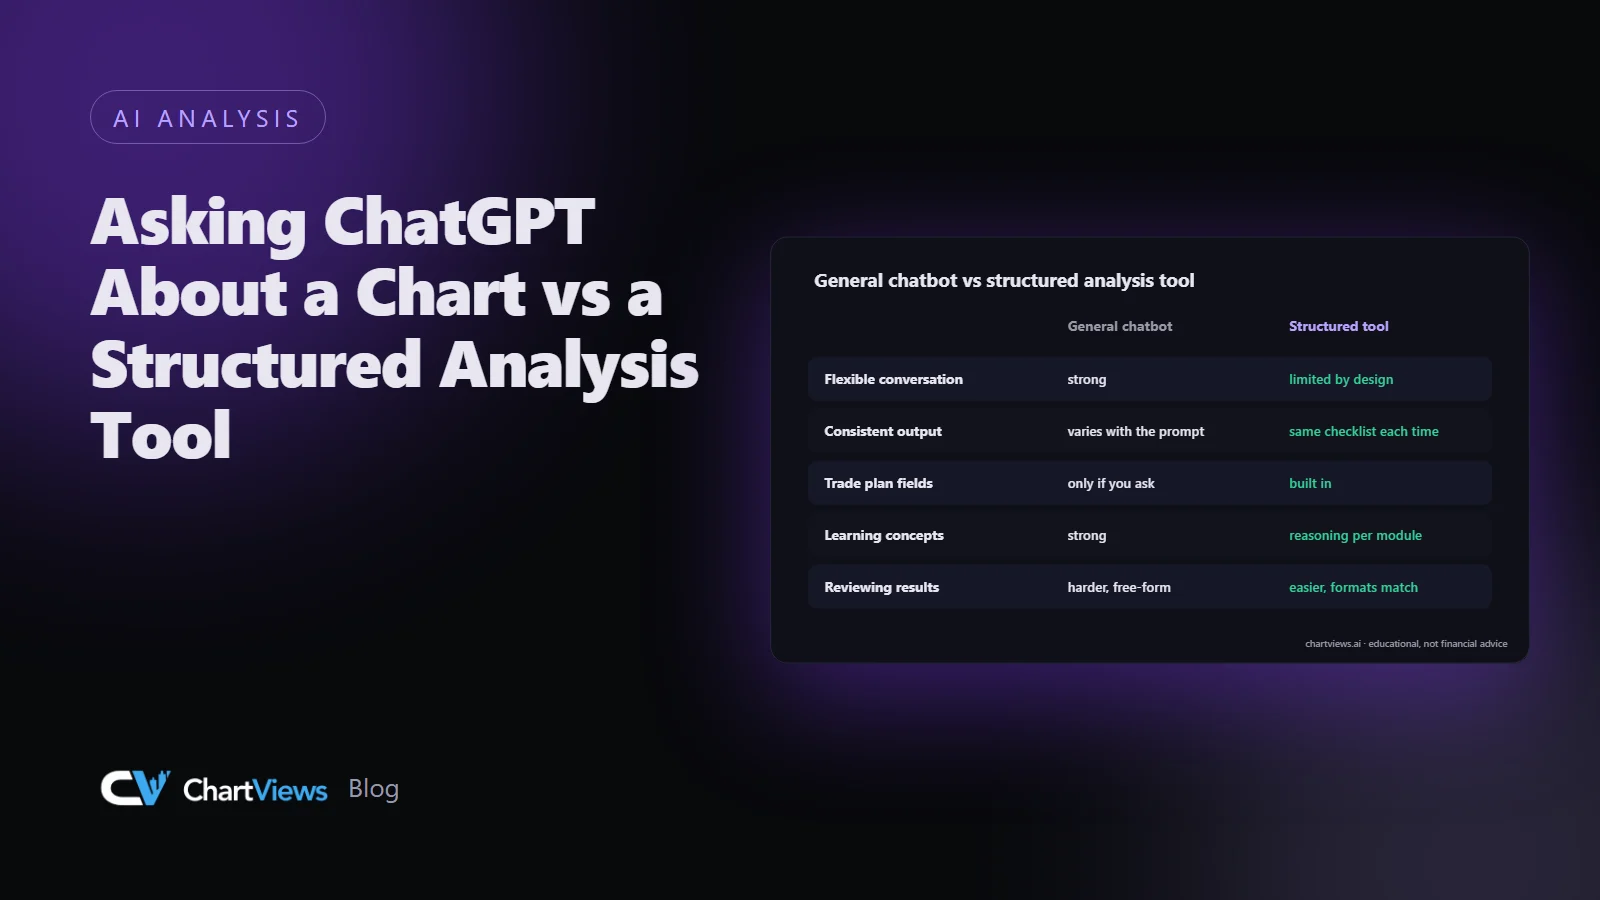
- Flexible conversation: strong in a general chatbot, limited by design in a structured tool.
- Consistent output: varies with the prompt in a chatbot, the same checklist each time in a structured tool.
- Trade plan fields: only if you ask in a chatbot, built in for a structured tool.
- Learning concepts: strong in a chatbot, and reports include the reasoning behind each module.
- Reviewing results over time: harder with free-form answers, easier when formats match.
For a fuller feature-by-feature view, see our comparison with ChatGPT.
Questions to ask before trusting either
Whichever tool you use, a few checks keep you honest. Do the price levels it quotes actually exist on your chart? Does the stop sit at a structural level rather than an arbitrary number? Does it mention what would make the idea wrong? Does it acknowledge uncertainty, or does it sound certain about something nobody can know? If an answer fails these checks, treat it as a rough sketch and do your own work before risking money.
A worked example, described in words
Imagine you have a four-hour chart of a major currency pair. You paste it into a chatbot with the question "Is this a buy?" You might receive a thoughtful paragraph describing an uptrend and a support zone. Useful, but the entry, stop and target may be vague, and a second attempt might lean the other way.
Now run the same chart through a structured analysis. You get the market structure read, the retracement zone, the liquidity levels above and below, any scheduled macro events and then a plan: where the idea is invalid, where the first target sits, and the resulting risk-reward. You may disagree with parts of it, and you should check it against your own view, but the pieces are laid out in a fixed order that you can inspect.
They can work together
This is not an either-or choice. A sensible workflow uses both for what they do best:
- Use a structured tool to get a consistent first read and a plan with numbers.
- Use a general assistant to ask why a level matters, to explain a term, or to stress-test your reasoning.
- Verify every level yourself on your own chart before acting.
A word on realistic expectations
No AI tool, general or specialised, can predict the market. Both types of tool describe and interpret a chart; neither removes uncertainty or the possibility of loss. The most important parts of trading remain yours: position sizing, discipline about invalidation, and the willingness to stay out when the picture is unclear.
If you want to see the structured approach on one of your own charts, you can run a free analysis and judge the output for yourself: try a free analysis.
Educational content, not financial advice. Trading involves risk of loss.
 Money Circle Blog
 Trader Reflect Blog