How to Find Support Resistance Fast
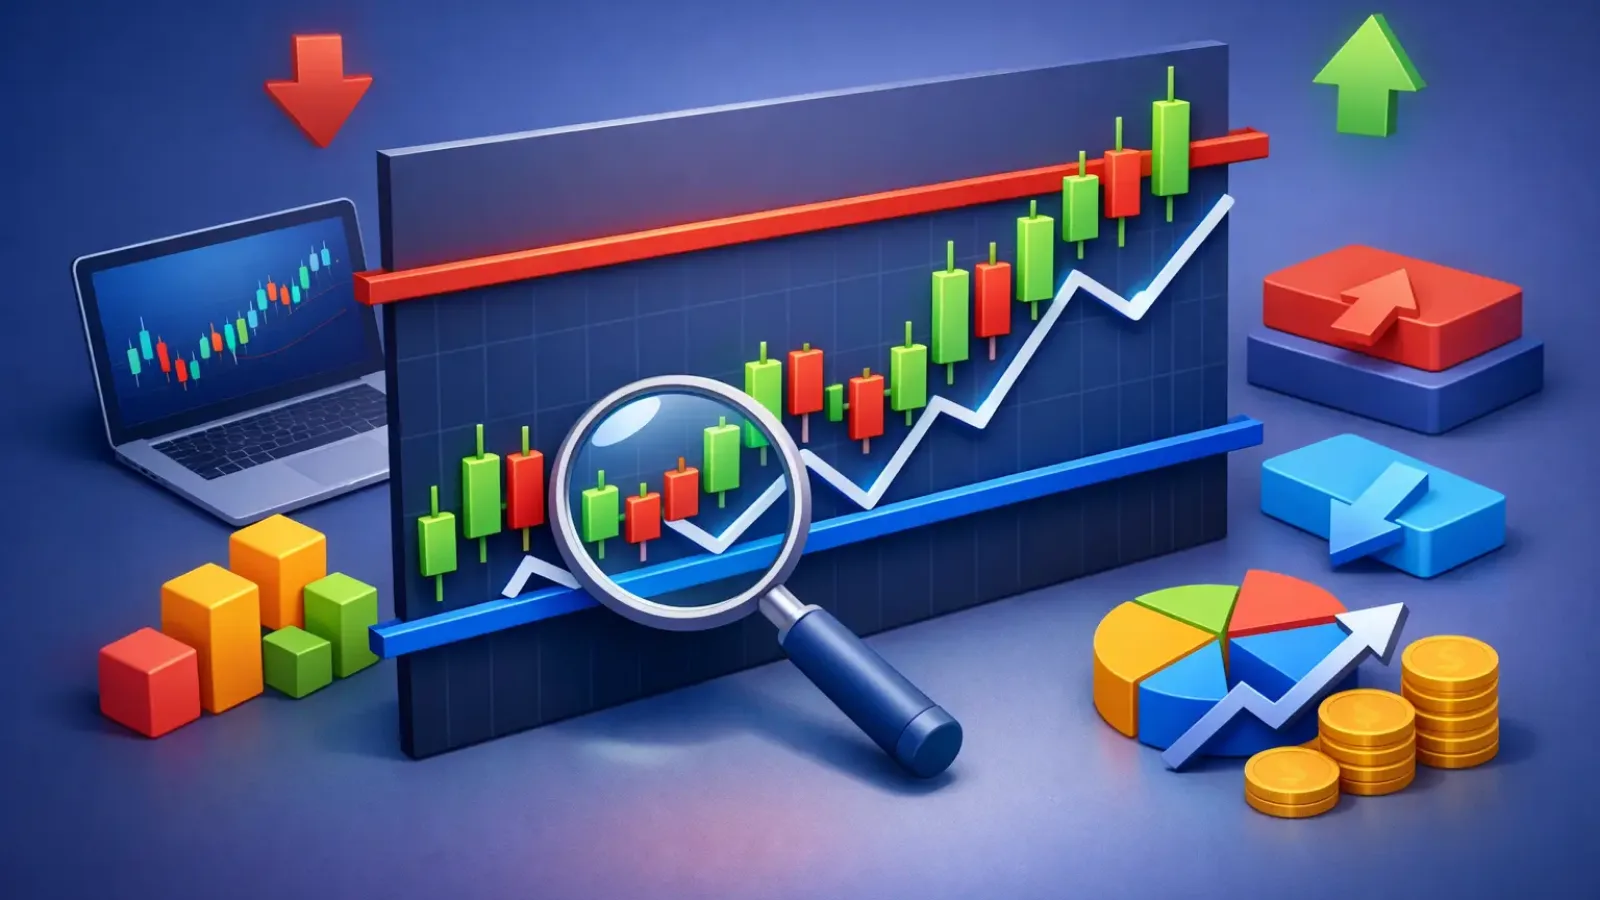
Most traders do not miss levels because charts are too complex. They miss them because they mark too many lines, trust weak zones, or force precision where the market only offers areas. If you want to learn how to find support resistance with more consistency, start by thinking in zones, not exact prices.
Support and resistance are where price tends to react. Support is the area where selling pressure fades and buyers step in. Resistance is where buying pressure slows and sellers start to defend price. That sounds simple, but the hard part is deciding which levels actually matter and which ones are just noise.
How to find support resistance without clutter
The fastest way to improve is to strip the chart down. Remove most indicators. Zoom out one step more than feels comfortable. On a clean chart, strong support and resistance usually show up where price changed direction more than once or moved away with clear momentum.
A good level leaves evidence. You will often see repeated touches, sharp rejections, long wicks, or consolidation before a breakout. The more times price respects a zone without slicing through it cleanly, the more attention that area deserves. But touches alone are not enough. A level tested six times with weak reactions is often less useful than one tested twice with aggressive reversals.
This is where many traders get into trouble. They draw every swing high and swing low, then end up with a chart that explains everything and predicts nothing. Useful levels are selective. They help you make decisions, not decorate the screen.
Start from higher time frames
If you trade on the 5-minute or 15-minute chart, your first mistake may be starting there. High-quality support and resistance usually come from higher time frames because more participants can see them and react to them. A zone that stands out on the daily chart will usually matter more than a minor intraday pivot.
Start with the daily or 4-hour chart. Mark the obvious turning points first. Look for prior weekly highs and lows, clean bases before strong rallies, and breakdown areas where price later stalled on the retest. Then drop to your execution time frame and refine the zone.
This top-down process gives you context. It also prevents the common problem of taking trades directly into a major level you never noticed. A clean setup on a lower chart loses a lot of value if price is sitting one candle away from a daily resistance zone.
Focus on the clearest reactions
Not every reversal point deserves a line. Prioritize areas with one or more of these traits: strong rejection, multiple reactions across time, high relative volume if your market provides it, and impulsive movement away from the level. Fast moves matter because they show imbalance. When price leaves an area aggressively, that area usually attracted real order flow.
If the market drifted sideways through a zone over and over, that level may still matter, but it is less clean. The best support and resistance zones tend to stand out quickly even before you start analyzing every candle.
Draw zones, not razor-thin lines
One of the biggest upgrades you can make is to stop treating support and resistance like exact numbers. Markets rarely reverse at the perfect penny or pip. They react inside areas.
Draw a zone around the cluster of reactions rather than a single horizontal line through one wick. On a support zone, that might mean spanning from the lowest wick to the candle closes nearby. On resistance, it may mean covering the area where several highs and failed pushes gathered.
This matters for execution. If you expect exact precision, you will either enter too early or get shaken out by normal volatility. A zone gives price room to behave naturally. It also helps you judge whether a breakout is real. A candle poking slightly above resistance is not the same as acceptance above the entire zone.
Use role reversal to spot stronger levels
A level becomes more interesting when support turns into resistance or resistance turns into support. This is called role reversal, and it is one of the clearest signs that a zone is worth tracking.
For example, if price breaks above a resistance area, pulls back, and then holds that same zone as support, you have more than a random horizontal mark. You have proof that market participants changed behavior around that price. The level has been tested in two different conditions, and that usually makes it more actionable.
This also helps with timing. Instead of chasing a breakout candle, you can wait for the retest and judge the quality of the response. That often improves entry location and reduces emotional decision-making.
Candlestick behavior gives the level context
Knowing where a zone sits is only half the job. You also need to know how price behaves when it gets there. A support zone with small indecisive candles and weak bounces is not the same as a support zone that prints long lower wicks and a strong reversal close.
The same applies to resistance. If price drifts into resistance with slowing momentum and repeated upper wicks, sellers may be active. If price drives into resistance with expansion and closes near highs, fading that move can be risky. Levels are not automatic trade signals. They are decision points.
That is the difference between mechanical line-drawing and actual chart reading. The level tells you where to pay attention. Price action tells you what to do next.
How to find support resistance in trend vs range markets
Market condition changes how you should use levels. In a range, support and resistance often act more cleanly. Price rotates from one side of the range to the other, and horizontal zones become the main framework for entries and exits.
In a trend, things are different. Resistance can keep breaking in an uptrend, and support can keep failing in a downtrend. In those conditions, the better use of support and resistance is often as pullback structure rather than reversal prediction. You are less focused on calling the exact top or bottom and more focused on finding where trend continuation is likely.
This is where traders overgeneralize. A resistance zone in a strong uptrend is not the same as resistance in a tired, range-bound market. Context decides whether a level is a place to fade price, take profits, or wait for a breakout and retest.
Confluence improves confidence, not certainty
The strongest levels usually do not stand alone. They line up with other signals. That may include trend lines, moving averages, prior session highs or lows, Fibonacci areas, or volume clusters. When several tools point to the same zone, the level tends to attract more attention.
But there is a trade-off here. Confluence helps, yet too much confirmation can make you late. If you wait for every signal to align perfectly, the best part of the move may already be gone. Strong trading is about stacking evidence, not demanding certainty.
A practical approach is to mark your zone first, then ask what else supports it. If nothing does, reduce confidence. If two or three independent factors align, the level deserves more focus.
Common mistakes that make levels unreliable
Most bad support and resistance work comes from a few repeat errors. Traders draw from insignificant swings, force levels on messy charts, ignore higher time frames, and treat every reaction as equal. Another common issue is revising levels after the fact until the chart looks perfect. That helps your ego, not your execution.
It also hurts to mark too many zones close together. If every nearby price area is labeled support or resistance, none of them are useful. The goal is to identify the areas most likely to change behavior, not every place where price paused for a candle or two.
A cleaner chart usually leads to cleaner decisions.
A faster workflow for active traders
If you review multiple markets each day, speed matters. A repeatable process beats intuition alone. Start high time frame, mark the obvious zones, drop to your trading chart, and watch how price approaches those areas. Then let the reaction determine whether you are looking at rejection, breakout, or no trade.
This is exactly why many traders now use AI-assisted chart analysis to reduce manual scanning time. A tool like ChartViews AI can help identify key support and resistance levels quickly, giving you a structured first pass before you make the final trade decision. That does not replace judgment. It improves workflow and helps you stay consistent when the market is moving fast.
The real edge is not drawing more lines. It is seeing the right levels sooner, understanding what makes them important, and reacting with discipline when price gets there. The next time you open a chart, do less first. The best support and resistance levels usually become clearer when you stop trying to find all of them.
Educational content, not financial advice. Trading involves risk of loss.
 Money Circle Blog

 Trader Reflect Blog