How to Reduce Trading Analysis Paralysis

A chart can offer ten reasons to enter and ten reasons to wait. Price is near support, but momentum is weak. The trend is up on the four-hour chart, yet resistance sits directly overhead. By the time you review every indicator and alternate scenario, the setup has moved. To reduce trading analysis paralysis, you need a process that turns chart information into a limited number of decisions.
Analysis is valuable. Endless analysis is not. Active traders do not need more opinions from a chart. They need a repeatable way to identify market context, define a valid setup, measure risk, and either execute or move on.
Why Trading Analysis Paralysis Happens
Analysis paralysis is rarely caused by a lack of knowledge. More often, it comes from having too many inputs without a hierarchy. A trader may scan multiple time frames, add several indicators, watch social sentiment, compare correlated markets, and still have no rule for deciding which signal matters most.
The result is a familiar cycle: find a possible setup, search for confirmation, find conflicting evidence, hesitate, then chase the move after it is already extended. This is not a chart-reading problem alone. It is a decision-system problem.
It becomes worse when every trade is treated as if it must be perfect. Markets do not offer certainty. A quality setup can lose, and a poor setup can win. Your objective is not to predict every move. It is to repeatedly take trades that meet defined conditions and manage the downside when the market disagrees.
Reduce Trading Analysis Paralysis With a Chart Hierarchy
Start by assigning each part of your analysis a specific job. Without this structure, every candle, indicator, and headline can feel equally urgent.
Your higher time frame should establish context. Is the market trending, ranging, or transitioning? It should also identify major support and resistance zones where price is likely to react. The execution time frame then helps you determine timing: whether price is confirming a breakout, rejecting a level, forming a pullback, or losing momentum.
This distinction prevents a common mistake: using a lower time frame to argue against a clear higher-time-frame trend. A five-minute chart may show a short-term bearish pullback inside a larger bullish structure. That does not automatically create a high-quality short trade. It may simply signal that a long entry is not ready yet.
Choose two time frames that fit your holding period and use them consistently. A day trader might use the one-hour chart for context and the five-minute chart for entries. A swing trader may use the daily chart for context and the four-hour chart for execution. The exact combination depends on your strategy, but the role of each chart should remain clear.
Limit Your Inputs Before You Look for Entries
More indicators do not necessarily create more confirmation. Often, they create duplicate information. RSI, stochastic, and MACD may all reflect momentum in different forms. When they disagree, traders can spend valuable time trying to resolve a conflict that does not materially improve the trade.
Build a compact chart-review framework around the signals that directly support your method. For many technical traders, that means market structure, key support and resistance, volume or momentum, and a defined trigger. Everything else must earn its place.
Before opening a position, answer four questions:
- What is the current market structure: uptrend, downtrend, or range?
- Where is the nearest meaningful support or resistance level?
- What specific price action confirms the trade idea?
- Where is the trade invalidated if price moves against it?
If you cannot answer these questions quickly, you do not have a clear setup yet. Waiting is a position. It protects capital and prevents forced trades.
Define What a Valid Setup Looks Like
A setup should be a rule set, not a feeling. Vague language such as looks strong or seems ready leaves too much room for emotion, especially after a fast move.
For example, a trend-pullback strategy might require a higher-time-frame uptrend, a retracement into a previously identified support zone, a bullish reaction candle on the entry chart, and a stop below the recent swing low. A breakout strategy could require consolidation below resistance, a close above the level, confirmation through volume or follow-through, and enough room to the next resistance level for a favorable reward-to-risk profile.
These conditions will vary by market and strategy. Crypto can move with more volatility than large-cap stocks. Forex sessions have distinct liquidity patterns. A breakout approach may work well in a strong trend and perform poorly in a choppy range. The point is not to use one universal setup. The point is to know exactly what qualifies for your account before real money is at risk.
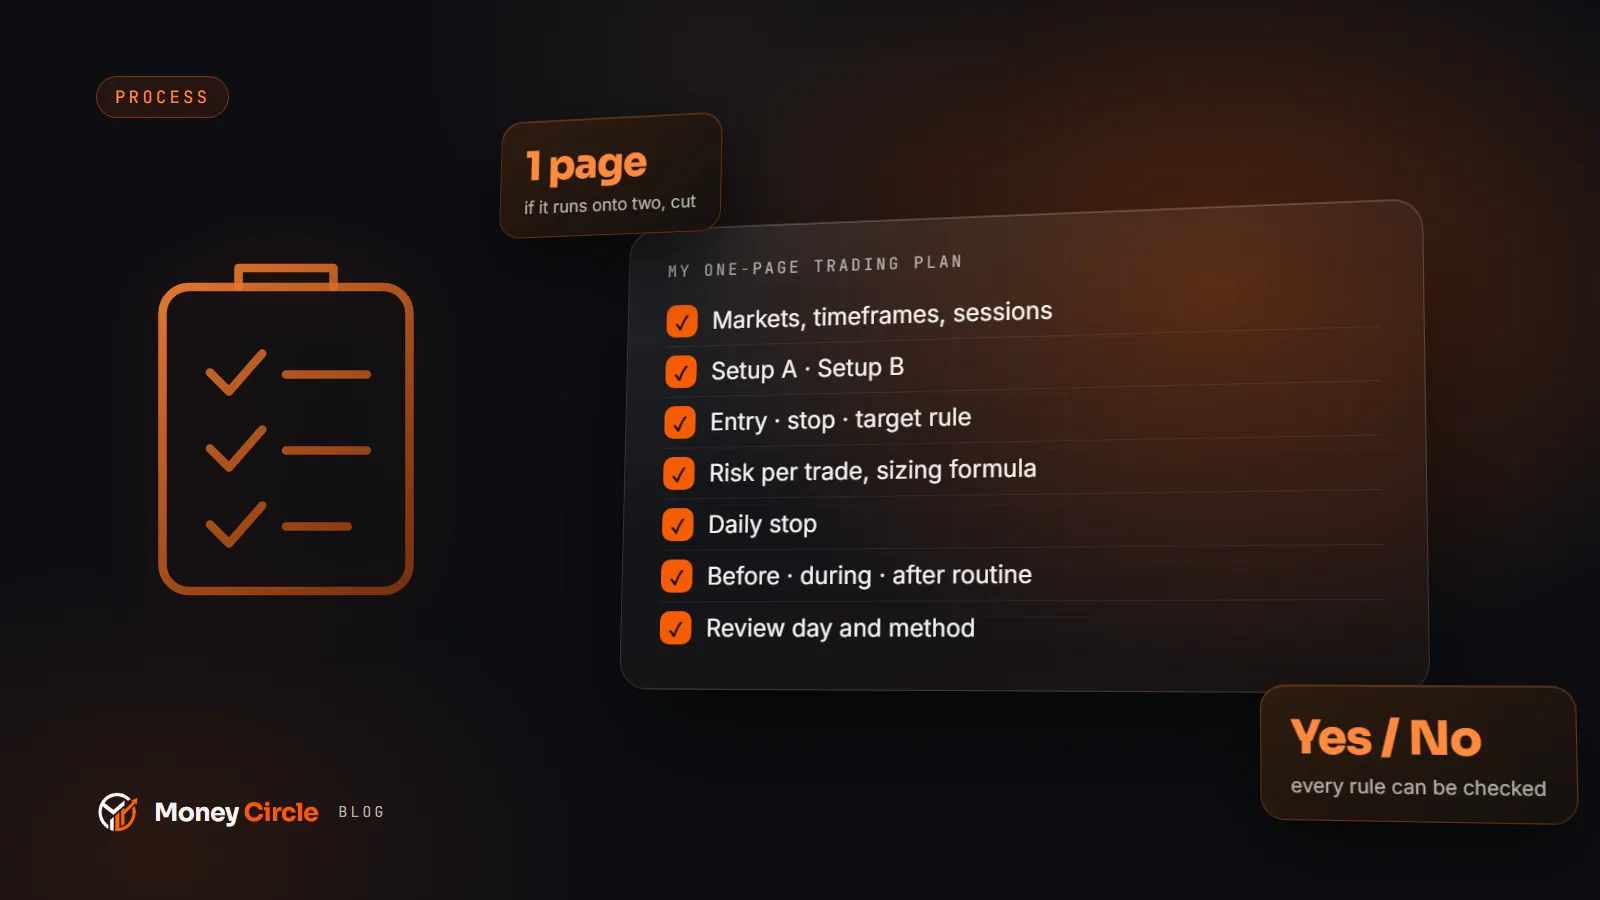
A written checklist makes that standard visible. It also reveals when you are trying to bend the rules because you do not want to miss a move.
Use a Decision Deadline
Give your analysis a time limit. If your plan calls for a 15-minute entry, spending 45 minutes researching the chart usually does not improve execution. It often causes you to enter late or abandon a valid setup because you found one more reason to doubt it.
Set a practical review window based on your trading style. During that window, evaluate the chart against your criteria. At the deadline, make one of three decisions: enter according to the plan, place an alert at the level that would create a valid setup, or reject the trade.
This is not a reason to rush. It is a way to stop indefinite deliberation. A trader who passes on a setup with discipline can review it later. A trader who enters late because of hesitation has already changed the risk profile.
Separate Analysis From Execution
Many traders create confusion by analyzing and executing at the same time. They identify a support zone, watch price approach it, then change the entry, stop, and target repeatedly as each new candle forms. That creates reactive trading instead of planned trading.
Do the work earlier whenever possible. Mark key levels, define the direction you are willing to trade, and decide what confirmation is required. Then, when price reaches your area of interest, your job becomes simpler: verify the trigger and manage risk.
This is where structured chart interpretation can save meaningful time. ChartViews AI can help traders review uploaded charts quickly by identifying trend direction, key support and resistance levels, and potential entry and exit areas. It is best used as a fast second look and a framework for decision-making, not as a replacement for your strategy, risk limits, or judgment.
Make Risk the Final Filter
A setup may look technically clean and still be a poor trade if the stop is too wide, the target is too close, or a major event creates unusually high uncertainty. Risk is what turns a chart idea into a trading decision.
Define your maximum loss per trade before you enter. Then size the position according to the distance between your entry and invalidation level. Do not move a stop farther away simply because the trade is uncomfortable. If the original invalidation point is no longer valid, reassess the trade rather than increasing risk to avoid taking a planned loss.
A simple final filter is useful: if the trade does not offer acceptable reward relative to its defined risk, skip it. Not every technically valid setup deserves execution. This rule alone removes many impulsive, low-quality entries.
Review Hesitation Without Beating Yourself Up
Keep a short record of trades you missed, took late, or avoided. The goal is not to prove that you should have entered every move. It is to identify the source of hesitation.
Did you lack a clear trigger? Were your levels too broad? Did you use too many indicators? Did you avoid the trade because the loss would have felt personal? Patterns in this review are more useful than replaying one missed opportunity.
Also track whether your skipped setups actually met your rules. If many did, your process may need a firmer execution trigger. If most were incomplete or poorly positioned, the hesitation may have protected you. Good trading discipline includes the ability to distinguish caution from avoidance.
The next time a chart presents conflicting signals, do not try to eliminate every doubt. Return to your hierarchy, check the setup conditions, define the risk, and make the next decision your process supports. Clarity is not certainty. It is knowing exactly what you need to see before you act.
Educational content, not financial advice. Trading involves risk of loss.
 Money Circle Blog
 Trader Reflect Blog