How to Read Gold (XAU/USD) Charts Around US Data Releases
Gold can sit quietly for hours, then move further in a minute than it did all morning. When that happens at 8:30 or 14:00 New York time, the cause is usually a US data release or a central bank decision. Reading a gold chart around those moments is less about predicting the number and more about knowing where you are, what the chart looked like before the event, and which of your own rules apply while the market is jumping.
This guide shows how to read an XAU/USD chart around scheduled US data, step by step. It is educational, not advice, and it does not say whether gold will rise or fall after any release. All prices below are hypothetical round numbers chosen to make the example easy to follow.
Why scheduled data matters for gold
Gold pays no interest, so traders often watch it alongside US interest rate expectations and the US dollar. Releases that change those expectations, such as inflation, jobs and growth figures, or a central bank rate decision and press conference, can move gold quickly. The link is not fixed, and the same figure can produce a different reaction on different days, depending on what the market had already priced in. That is the key point: the surprise matters more than the number itself.
For chart reading, it means that around a release, price action is dominated by an event, not by the structure you drew earlier. Your structure still matters afterwards, but during the event spreads widen, fills slip and candles can look like a different market.

Step 1: know the calendar before you open the chart
Start the day with the list of scheduled releases for the hours you plan to trade, with their times converted to your own time zone. Write down which ones you consider major. Use a calendar from an official or well-known source and double check times, because daylight saving changes can shift them by an hour for a few weeks of the year.
Mark each release on your chart with a vertical line, or at least write the time on a note. Then decide in advance: will you trade through it, or stand aside before it? Both are legitimate choices. The mistake is to have no decision and to find yourself in a trade when the release lands.
Step 2: map the levels before the event
An hour or two before the release, do your normal level work on the daily and four-hour charts. Mark the zones where gold has reacted several times, the previous day's high and low, and the range of the past session. Our guides to support and resistance levels that matter and how to find support and resistance fast explain the method.
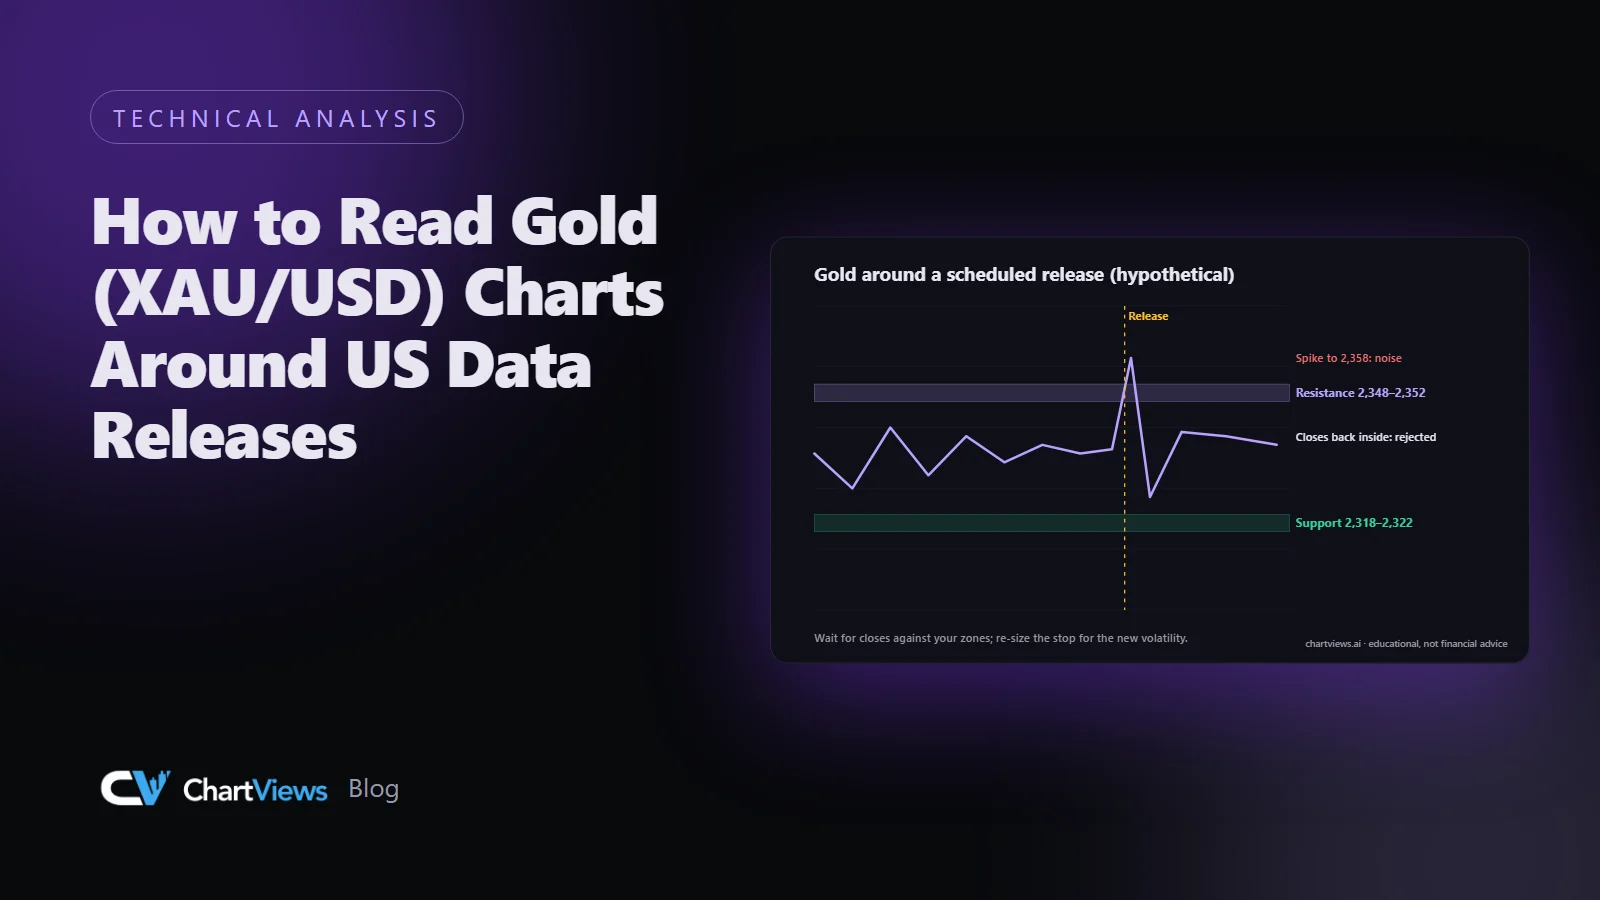
Suppose, hypothetically, that gold has traded between 2,320 and 2,350 for most of the morning. You mark a resistance zone around 2,348 to 2,352 and a support zone around 2,318 to 2,322. These are your reference points when the candles start to move.
Step 3: read the pre-release behaviour
Look at what price does in the hour before the release. Typical patterns include:
- Compression: candles get smaller and the range narrows as traders wait. This often ends with a sudden expansion, in either direction.
- Positioning drift: price creeps towards one side of the range. That is not a forecast, but it tells you where the stops of late traders may sit.
- Wider spreads: many brokers widen the spread in the minutes before a release. Check your own platform's live spread.
None of these tells you the direction of the break. What they give you is context: if a compressed range is about to be released, the first move can be a spike through your zone and back.
Step 4: expect the first candle to be noise
The first one or two candles after a release are often the least reliable. Price can spike in one direction, reverse and spike the other way, all inside the first minute. Spreads are wide, quotes can skip, and a stop placed inside the spike can be hit even though the later move goes your way.
Hypothetically, imagine gold spikes from 2,335 to 2,358 within one minute of the release, trading through your resistance zone, then falls back to 2,340 by the end of the five-minute candle. A trader who treats the spike as a breakout would have bought the top. A trader who waits sees that the zone was tested and rejected on the first pass.
This is why many traders do not trade the first candle at all. Waiting costs you the first part of any move, and in return you avoid the worst fills.
Step 5: let structure confirm, on a closed candle
After the first minutes, return to your own rules. Ask what price has done to the zones you marked earlier:
- Did a candle on your signal timeframe close beyond a zone, or only wick through it?
- Is price holding above the zone it broke, or has it closed back inside?
- Is the retest happening on smaller candles with less volatility?
Using closes rather than wicks is a way to avoid being fooled by the spike. If your plan trades breakouts, a closed fifteen-minute or one-hour candle beyond the zone is a stronger reading than a five-second print. Our guide to what causes false breakouts goes into this in more detail.
Step 6: re-draw your risk, because volatility changed
After a release, the typical candle range is larger than before. A stop that was sensible in the quiet morning may be too tight now, and a stop wide enough for the new volatility means a smaller position if you keep your risk per trade the same. The arithmetic is the same as always: the amount at risk divided by the stop distance. Our guide to position sizing with a fixed percentage of risk shows the formula.
For example, a stop of 4.00 price units before the release might need to be 10.00 afterwards to sit beyond the noise. At the same risk amount, that means a position less than half the size. If that no longer gives a worthwhile reward-to-risk, the answer is to skip the trade, not to squeeze the stop.
Step 7: know when not to trade
Some conditions are a reason to stand aside altogether:
- You did not know the release was coming.
- The spread is several times its normal size.
- Price is moving faster than you can place an order sensibly.
- You have just taken a loss and want to win it back with the first big candle.
- Your plan does not describe a trade for this situation.
Having no position during a release is a valid result. Many traders set a simple rule: no new entries within a set time before a major release, and none until a set time after it. Pick numbers that suit you and write them in your plan.
A short checklist
Before a scheduled US release:
- I know the time, in my own time zone.
- I have marked the key zones on the daily and four-hour charts.
- I have decided whether to be flat, and my open trades have stops I accept.
- I know my live spread, and my risk per trade is unchanged.
After the release:
- I waited for the first candles to settle.
- I judge the move by closes against my zones, not by wicks.
- I re-sized for the new volatility.
- I logged the trade, or the decision not to trade, in my journal.
Using a second read
A structured chart read can help with the level-mapping step. If you upload an XAU/USD chart to ChartViews AI, it returns an organised view of trend, support and resistance, and possible scenarios, which you can compare with your own marks before the release. It cannot know the data that is about to come out, and it does not account for slippage, so the trade decision and its risk stay with you. See what the analysis includes, or read our walkthrough on how to read an AI chart analysis report.
Want a structured second read of your own gold chart? Run an analysis on ChartViews AI.
Educational content, not financial advice. Trading involves risk of loss.
 Money Circle Blog
 Trader Reflect Blog