A Guide to Trading Decision Support That Works

A guide to trading decision support should make one thing clear: better decisions do not come from finding a magic indicator. They come from turning market information into a repeatable plan before capital is at risk. For active traders, that means identifying the trend, defining the key price levels, choosing an entry condition, and knowing exactly where the trade is wrong.
The market moves quickly, but fast decisions should not be impulsive decisions. Trading decision support gives you a structured way to review a chart, reduce noise, and act only when the setup fits your rules. It is especially useful when you are scanning multiple stocks, forex pairs, or crypto assets and need a consistent process rather than a different opinion on every chart.
What Trading Decision Support Actually Does
Decision support is not a replacement for judgment. It is a framework that organizes what matters most on a chart so you can assess a trade with more speed and less guesswork.
At its best, it answers practical questions: Is the market trending or ranging? Where are buyers and sellers likely to react? Is price approaching a level with a favorable risk-to-reward profile? What would confirm the trade, and what would invalidate it?
Those questions matter because a chart can support more than one story. A breakout may be the start of momentum or a false move into resistance. A pullback may be a high-quality continuation entry or the first sign that a trend is weakening. Decision support does not eliminate uncertainty. It helps you define it, measure it, and avoid trading vague ideas.
The strongest systems combine chart structure with risk management. An entry signal without a stop level is incomplete. A support level without context from the higher-timeframe trend can be misleading. The goal is not more analysis. The goal is analysis that leads to a clear decision.
Start With Market Structure, Not Indicators
Indicators can help, but price structure should come first. Before looking at moving averages, RSI, volume tools, or pattern labels, determine how price is moving.
An uptrend generally shows higher highs and higher lows. A downtrend shows lower highs and lower lows. A range develops when price repeatedly rotates between defined support and resistance without a sustained directional break. This first read shapes the entire trade plan.
If the daily chart is trending higher, a pullback into support may offer a more favorable long setup than a short trade against the larger move. If price is in a tight range, breakout entries may require confirmation because price can reverse quickly at either boundary. If the trend is bearish, a bounce is not automatically a buy signal. It may simply be a retest before sellers regain control.
Timeframe alignment matters, but it depends on your holding period. A day trader might use a 15-minute chart for execution and a one-hour chart for context. A swing trader may use the daily chart for the setup and the weekly chart to identify major levels. There is no universal timeframe that works for every strategy. The right one is the one that matches how long you intend to hold the position.
Mark the Levels That Can Change the Trade
Support and resistance are decision zones, not exact lines. They are areas where price previously paused, reversed, consolidated, or accelerated. These zones can reveal where supply and demand may reappear.
Focus on levels that have clear evidence behind them. Prior swing highs and lows, range boundaries, breakout points, major moving averages, and high-volume areas can all matter. The more often a zone has influenced price, the more attention it deserves. Still, repeated tests can also weaken a level as orders are absorbed, so do not assume every retest will hold.
When marking a level, ask what price needs to do there. A long position near support is not justified just because price touched a line. You may need to see a reclaim, a higher low, a strong reversal candle, rising volume, or confirmation from the broader trend. The same principle applies at resistance. A level becomes actionable when market behavior supports the trade idea.
This is where instant AI-powered chart analysis can save time. ChartViews AI can interpret an uploaded chart, identify trends and key support and resistance zones, and surface potential entry and exit areas. The value is not blind automation. It is getting a structured first read quickly, then applying your own strategy, market context, and risk rules.
Build Every Trade Around Four Decisions
A trade should be simple enough to explain before you enter it. If you cannot state the setup, trigger, invalidation, and target clearly, the chart may not be ready to trade.
1. Define the setup
The setup is the market condition you want to trade. It could be a pullback in a strong uptrend, a breakout from consolidation, a breakdown below range support, or a reversal at a higher-timeframe level. Avoid entering because the chart merely looks active. Define the pattern and the context that give it meaning.
2. Set the entry trigger
The trigger is the event that moves the idea from watchlist to trade. For example, it might be a close above a breakout level, a retest that holds, or a break above the prior candle’s high after a pullback. Specific triggers reduce the temptation to enter early out of fear of missing a move.
3. Place the invalidation point
Your stop should sit where the original thesis is no longer valid, not at a random percentage that feels comfortable. If you are buying support, a decisive break below that support may invalidate the idea. If you are trading a breakout, a quick rejection back into the range may be the warning sign.
The distance to invalidation determines position size. Wider stops require smaller positions if you want to risk the same dollar amount. This is one of the most important disciplines in trading: adjust size to risk, not risk to the size you want to trade.
4. Plan the exit before the entry
A target can be the next resistance zone, a measured move, a prior swing point, or a trailing exit based on your system. It depends on whether you are trading a quick momentum move or a larger trend.
Be realistic about risk-to-reward. A trade with a small stop and a distant target may look attractive on paper, but only if the target is plausible before major opposing levels. If price has resistance directly overhead, a 3-to-1 target may be less realistic than it appears.
Use AI for Speed, Not Permission
AI decision support is most valuable when it reduces repetitive chart review. It can help you surface trend direction, key levels, potential scenarios, and areas that deserve a closer look. That is a productivity advantage for traders who scan many instruments or struggle to apply technical analysis consistently.
But an AI output is not a trade command. Charts do not contain every factor that can move a market. Earnings, economic releases, central bank decisions, liquidity conditions, and sudden news can change the setup fast. A technically clean chart can still fail when volatility expands.
Use AI as a second set of eyes and a way to standardize your process. Compare its chart read with your own. If the analysis identifies support but the larger trend is weak, wait for confirmation or pass. If it highlights a breakout level but volume is thin and a major news event is near, reduce exposure or stay patient. Good decision support improves discipline because it gives you a clearer basis for saying no.
Avoid the Most Expensive Decision Errors
Most trading mistakes are process mistakes before they become market mistakes. Chasing a candle after it has already moved, widening a stop to avoid taking a loss, and entering without a defined target all come from acting before the plan is complete.
Another common error is treating every level as equally important. Charts are full of minor pivots. Prioritize the zones that align with the trend, the timeframe, and visible market participation. A level on a five-minute chart may matter for a scalp, but it should not override a major daily resistance zone for a swing trade.
Also watch for analysis paralysis. More indicators and more opinions do not automatically create more confidence. If your process requires ten confirmations, you may enter too late or skip valid opportunities. Build a concise checklist that fits your strategy, then follow it consistently.
Make the Process Repeatable
The real advantage of trading decision support is consistency. Review the trend. Mark the levels. Define the setup. Wait for the trigger. Calculate position size from the stop. Plan the exit. Record what happened.
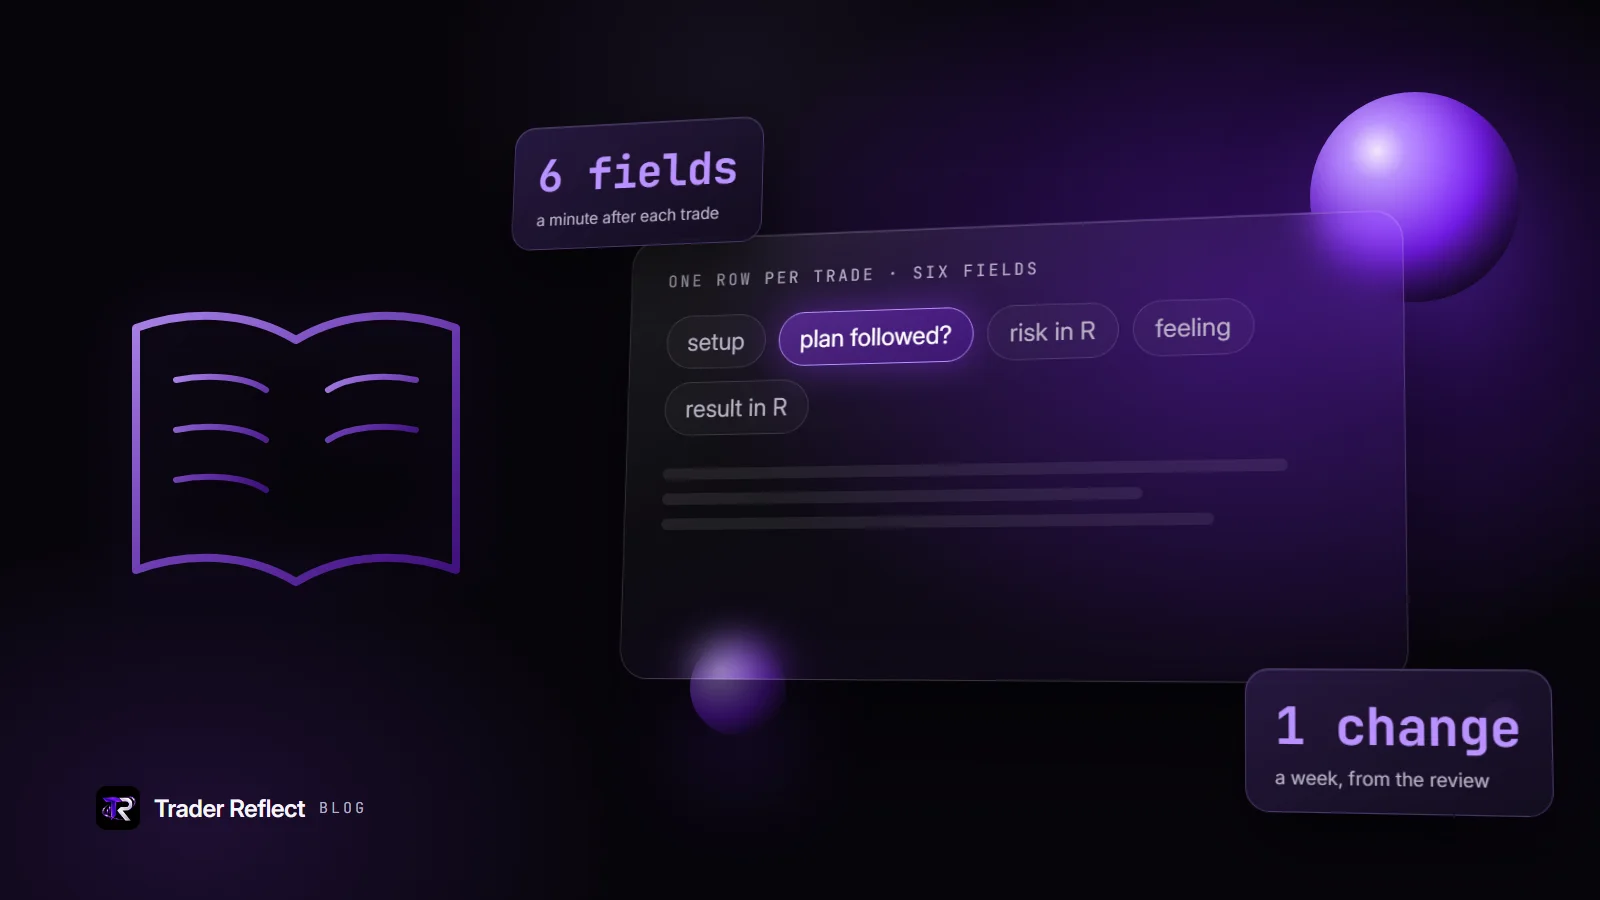
Keep a journal with chart screenshots, your reason for entry, your risk level, and the outcome. Over time, this shows whether your edge comes from breakouts, pullbacks, reversals, specific market sessions, or particular assets. It also exposes patterns that are harder to see trade by trade, such as taking profits too early or entering before confirmation.
The next time a chart catches your attention, do not ask whether it feels like a good trade. Ask whether it meets a defined decision process. That small shift turns chart reading from reaction into execution.
Educational content, not financial advice. Trading involves risk of loss.
 Money Circle Blog
 Trader Reflect Blog