Upload Chart for Analysis and Trade Faster
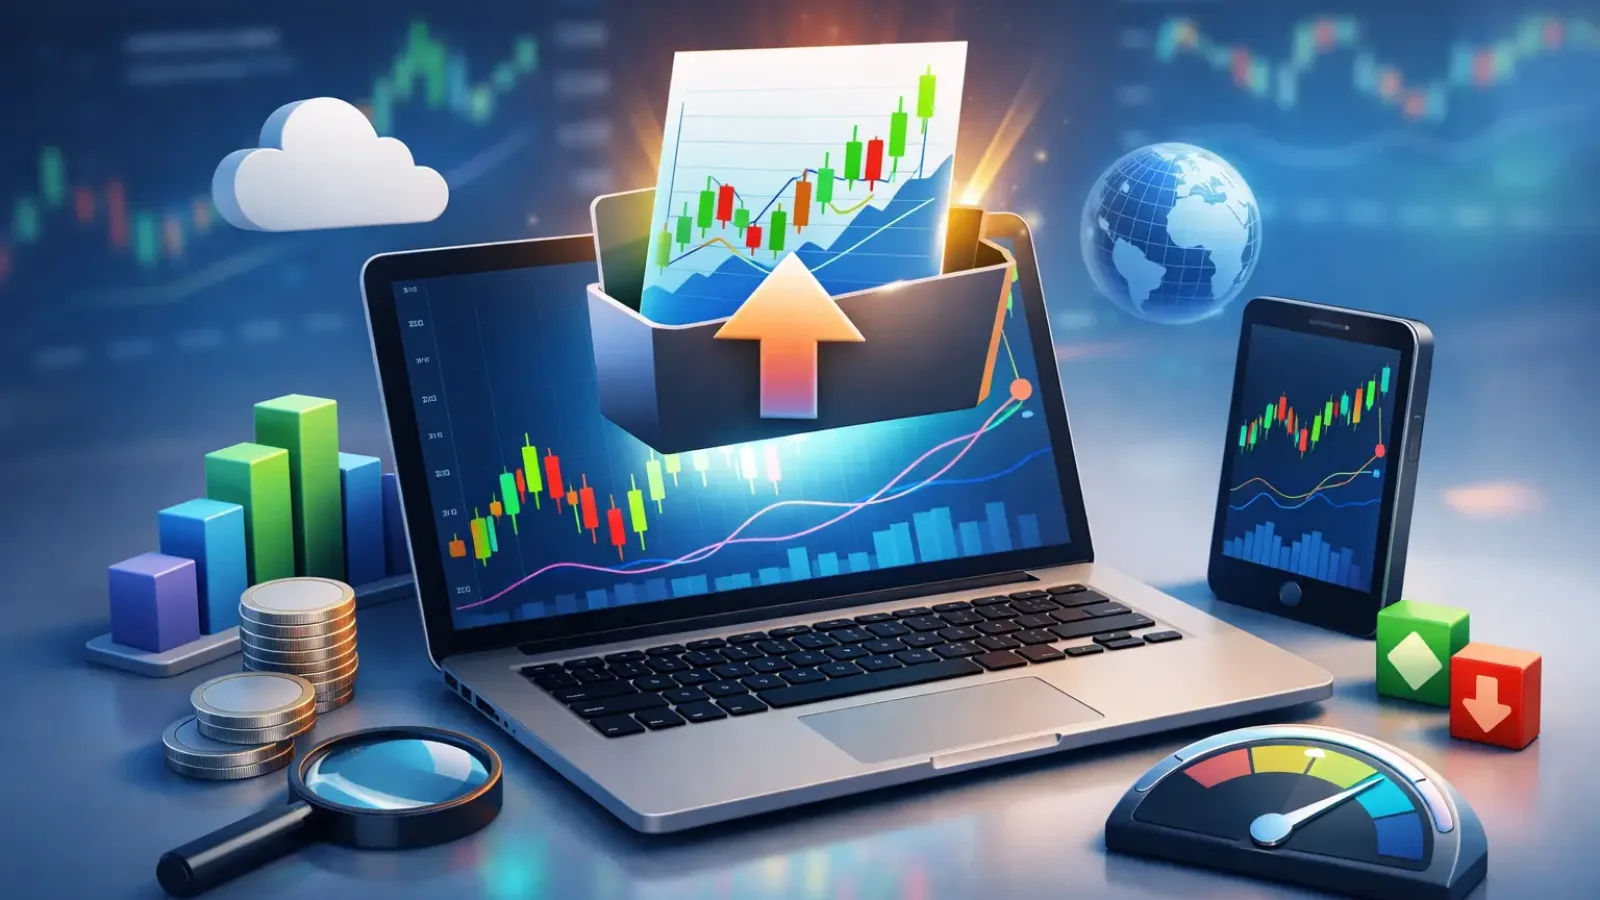
A good setup can disappear while you're still second-guessing a trendline. That is exactly why more traders upload chart for analysis instead of spending extra time manually reviewing every candle, wick, and level. When speed matters, structured analysis matters just as much.
For active traders, the real problem is rarely access to charts. It is interpretation. You can pull up a stock, crypto pair, or forex setup in seconds, but identifying trend direction, key support and resistance, and realistic entry and exit zones still takes time. On busy trading days, that delay adds friction where you need clarity.
Why upload chart for analysis matters
Uploading a chart for analysis changes the workflow from open-ended review to focused decision support. Instead of staring at a screen and asking ten different questions at once, you get a structured read on the chart that helps you quickly understand what matters now.
That matters for beginners because chart reading can feel inconsistent. One day a level looks obvious, and the next day the same pattern feels unclear. It also matters for experienced traders who already know technical analysis but want to move faster across multiple setups without losing discipline.
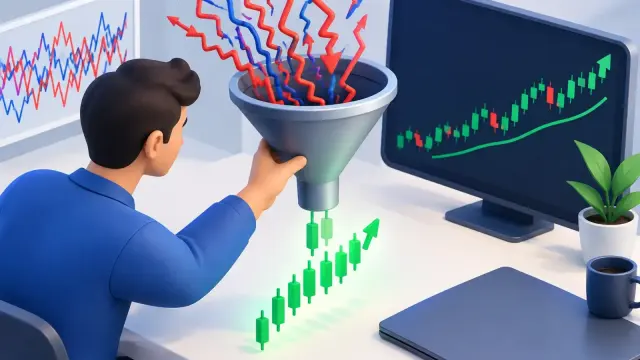
The biggest advantage is not that AI replaces judgment. It is that AI reduces wasted motion. If a tool can highlight trend bias, major zones, and possible trade paths in seconds, you spend less mental energy on chart triage and more on evaluating whether the setup fits your plan.
What traders want from an uploaded chart analysis
Most traders are not looking for vague commentary. They want answers that can improve timing and decision quality. That usually starts with trend identification. Is price moving higher, lower, or ranging? If the trend is unclear, that alone can save you from forcing a trade.
Support and resistance are the next priority. These levels shape risk, entry quality, and target selection. When they are identified clearly, it becomes easier to judge whether price is reacting at a meaningful zone or just moving randomly inside noise.
Then comes the practical layer. Traders want to know where a pullback might become interesting, where a breakout may fail, and where invalidation should sit if the trade goes wrong. Good analysis turns a chart from a picture into a plan.
How the process should work
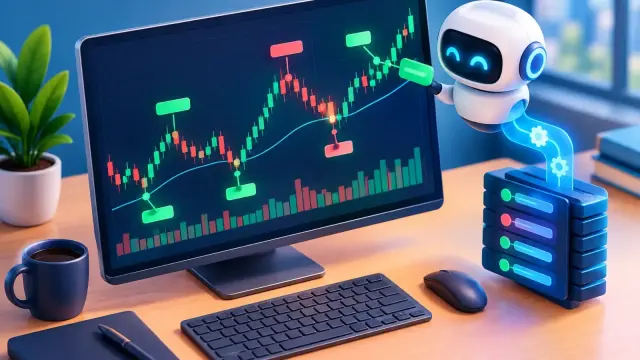
The best chart analysis tools remove steps, not add them. You upload an image of your chart, the system reads the structure, and you receive instant feedback in plain trading language. That process should feel fast enough to fit inside your normal routine, whether you are scanning premarket, reviewing swing setups after work, or checking intraday moves between meetings.
The quality of the output matters more than the novelty of the feature. Fast analysis is only useful if it is organized. Traders need a clear breakdown of trend, key zones, possible scenarios, and actionable levels. If the output is cluttered or overly technical, it slows the user down instead of helping.
This is where a platform like ChartViews AI fits naturally into the workflow. The value is not just AI for its own sake. The value is instant chart interpretation that turns visual price action into structured trade support.
What makes uploaded chart analysis useful in real trading
A useful analysis does not promise certainty. Markets do not work that way. What it should do is improve consistency. If you review charts the same way every time, you are less likely to chase random moves, ignore key levels, or invent trade ideas after the fact.
That consistency is especially important when emotions start to distort judgment. A chart can look bullish because you want it to be bullish. It can look ready to break down because you are anchored to the last red candle. Objective, structured analysis helps narrow that bias.
There is also a strong productivity angle. If you trade several markets or monitor a broad watchlist, manual review becomes expensive in terms of attention. Uploading charts for analysis can compress that work, making it easier to sort weak setups from strong ones without burning out before the session even begins.
Where AI chart analysis helps most
This approach is especially effective in a few common situations. The first is early-stage screening. When you have multiple charts to review, fast analysis helps you identify which ones deserve deeper attention.
The second is confirmation. Maybe you already see a trend and a key level, but you want a second layer of validation before committing risk. In that case, AI analysis can act as a discipline tool rather than a decision-maker.
The third is education through repetition. Beginner and intermediate traders improve faster when they can compare their own reads against a structured explanation. Over time, that repeated feedback can sharpen pattern recognition and reduce the guesswork that leads to inconsistent entries.
The trade-offs traders should understand
There is a right way to use chart analysis tools and a wrong one. The right way is to treat them as decision support. The wrong way is to treat them as a guaranteed signal engine.
An uploaded chart only shows part of the market picture. It may not reflect your timeframe bias, upcoming economic news, earnings risk, liquidity conditions, or broader market context unless you bring that context into your own process. A clean technical setup can still fail for reasons outside the chart image.
There is also the question of chart quality. If the screenshot is cluttered, low resolution, or packed with overlapping indicators, the analysis may be less useful. Clean charts generally produce cleaner interpretation. That is not a flaw in the workflow. It is a reminder that better inputs usually create better outputs.
Timeframe matters too. A bullish setup on a five-minute chart can sit inside a clear downtrend on the four-hour chart. Traders who upload chart for analysis should know what decision they are trying to make before they do it. Are you planning a scalp, a day trade, or a swing position? The answer changes how the analysis should be used.
How to get better results when you upload chart for analysis
Start with a chart that reflects your actual trading view. Use the timeframe you plan to trade, keep the image readable, and avoid unnecessary clutter. If your process depends on price structure more than indicators, let price remain the focus.
Then use the analysis to answer a small set of practical questions. What is the current trend? Where are the major support and resistance levels? Is price near a decision zone or in the middle of nowhere? What would confirm the setup, and what would invalidate it?
That approach keeps the tool tied to execution. Instead of asking for general insight, you are using the output to improve trade location, risk planning, and patience. That is where efficiency starts to turn into better decisions.
Why this workflow fits modern retail trading
Retail traders have more access to markets than ever, but access does not equal clarity. The edge often comes from processing information faster without getting sloppy. Upload-based chart analysis fits that need because it shortens the gap between seeing a chart and understanding the setup.
It also lowers the barrier to more disciplined technical analysis. You do not need to be an advanced chart reader to benefit from a structured read. And if you already have experience, the speed advantage is still meaningful. Faster review can help you cover more setups, stay organized, and avoid hesitation when a high-quality opportunity appears.
The best part is that this kind of workflow respects how traders actually operate. You are not trying to outsource the entire trade. You are trying to reduce friction, improve consistency, and make clearer decisions under time pressure.
If your chart review feels slow, inconsistent, or overloaded, the answer may be simpler than adding more indicators or watching more videos. Sometimes the smart move is to upload the chart, get the analysis, and spend your energy where it counts most - deciding whether the trade is worth taking.
Educational content, not financial advice. Trading involves risk of loss.

 Money Circle Blog
 Trader Reflect Blog