Why Do Trade Setups Fail? 8 Fixes That Matter

A chart can show a clean breakout, a well-defined support level, and a favorable risk-to-reward ratio - then still produce a losing trade. That is why do trade setups fail is the wrong question if it assumes every loss came from a bad pattern. Often, the setup was reasonable. The context, execution, sizing, or expectation was not.
A setup is a probability, not a promise. Your edge plays out over a series of trades, not on the one chart that looks perfect at 9:45 a.m. The goal is not to eliminate losing trades. It is to identify avoidable failures, protect capital when conditions change, and execute the same process consistently.
Why Do Trade Setups Fail Even When the Chart Looks Good?
Technical setups fail for two broad reasons. Sometimes the market invalidates the original idea. Other times, the trader turns a valid idea into a poor trade through late entries, loose risk control, or decisions made after the position is open.
A candlestick pattern or support-resistance zone does not exist in isolation. Trend direction, volatility, liquidity, session timing, and nearby levels all affect the odds. A bullish breakout above resistance has a different quality when the broader market is trending higher than when it occurs after an extended run into a major daily supply zone.
The practical shift is simple: stop grading setups only by whether they won or lost. Grade whether the trade met your rules, whether the market environment fit the strategy, and whether your loss stayed within the amount you planned to risk.
1. The Trade Ignores Higher-Timeframe Context
Many failed entries begin with a good signal on the wrong part of the chart. A five-minute bullish reversal can be technically valid while price remains trapped beneath a major hourly resistance level. In that case, the setup may offer a quick scalp, but it is not automatically a high-conviction swing entry.
Before entering, identify the dominant trend and the nearest meaningful levels on at least one higher timeframe. Ask where price is located within the larger range. Is it breaking into open space, or is it pressing directly into resistance? Is your short aligned with a broader downtrend, or are you trying to catch a reversal after a sharp selloff?
This does not mean you can only trade with the trend. Countertrend trades can work, but they require tighter targets, faster decision-making, and more selective entries. The trade-off is clear: you may capture reversals, but you should not manage them as if they have the same follow-through potential as trend-aligned setups.
2. The Entry Happens After the Move
FOMO turns many chart ideas into bad trades. Price breaks a level, accelerates, and suddenly the planned entry is far away. The trader enters anyway, often just before the first pullback.
A late entry changes the entire structure of the trade. Your stop may need to sit farther away, your target may be closer than it was at the original trigger, and the risk-to-reward ratio can collapse. A setup with a planned 2:1 payoff can become a 0.8:1 trade in seconds.
Define the entry before price reaches it. That might be a break and close above resistance, a retest that holds, or a pullback into a moving average within a trend. If the entry zone is missed, let it go. There will be another chart. Chasing is not adaptability. It is abandoning the plan after the market has already moved.
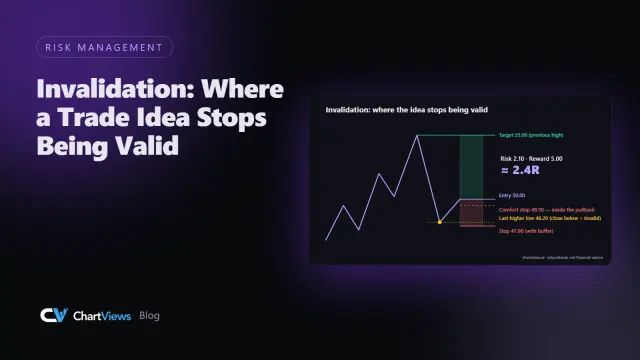
3. There Is No Clear Invalidation Level
A stop loss should answer one question: where is the trade idea proven wrong? It should not be based on a random dollar amount or a distance that merely feels comfortable.
For a long trade, invalidation may sit below the swing low that supports the thesis. For a short, it may sit above the failed breakout high or the resistance zone you expect to hold. If price reaches that level, the reason for entering no longer exists.
The common mistake is widening the stop once price moves against the position. That does not give the setup more room. It changes the risk after you have accepted the trade. A wider stop can be appropriate only if it was planned before entry and your position size was reduced to keep dollar risk fixed.
4. Position Size Is Too Large for the Setup
Oversizing makes normal market movement feel unbearable. A small pullback becomes a reason to exit early. A modest loss becomes emotionally charged. Then the next trade is often forced, skipped, or doubled in size to recover.
Position size should be calculated from the distance between your entry and stop, along with the maximum amount you are willing to lose. If your stop is wider, your size should be smaller. This keeps risk consistent across volatile crypto pairs, slower stocks, forex trades, and different timeframes.
A smaller position may feel less exciting, but it gives your analysis room to work. Discipline is easier when one trade cannot materially damage your account or your decision-making.
5. The Setup Is Taken During Poor Market Conditions
Not every strategy belongs in every market. Breakout systems often struggle in low-volume, range-bound conditions. Mean-reversion entries can get punished during strong directional trends. Even a reliable setup may underperform around major economic releases, earnings, or sudden headlines that expand volatility and invalidate technical levels quickly.
Check the current environment before you apply the pattern. Is price trending, ranging, or becoming erratic? Is volume confirming the move? Is there a scheduled event that could create a volatility spike during your holding period?
This is not a reason to avoid trading whenever uncertainty exists. Markets always contain uncertainty. It is a reason to match the strategy to the conditions. If the environment does not fit your edge, sitting out is an active risk decision.
6. The Trader Treats One Signal as Confirmation
A single indicator rarely carries enough information to justify a trade. RSI can stay overbought in a strong uptrend. A moving-average crossover can lag after much of the move has already happened. A breakout candle can close above a level and still fail if participation is weak.
Stronger setups combine independent evidence. For example, a long may have higher-timeframe trend alignment, a reclaim of support, improving volume, and enough open space to the next resistance level. These factors do not guarantee success, but they create a more complete thesis.
Avoid stacking several versions of the same signal and calling it confirmation. Three momentum indicators may all be measuring nearly the same thing. Price structure, volume, trend, and location within the range typically provide more useful confirmation than an overloaded indicator panel.
7. Profit Targets and Exits Are Improvised
Traders often plan entries carefully and exits emotionally. They take profits too early because they fear a pullback, then hold losers because they hope for a reversal. That combination damages expectancy even when the win rate looks acceptable.
Set the exit framework before entering. Identify the first obstacle where price may stall, the larger target if momentum continues, and the condition that tells you to exit early. A partial exit can make sense when price reaches a major level, but only if it fits a tested plan rather than a reaction to every candle.
The right target depends on the setup. In a tight range, taking profits near the opposite boundary is logical. In a strong trend with expanding volume, a trailing stop may capture more of the move. Your exit method should match the market structure, not your mood.
8. There Is No Feedback Loop After the Trade
Without a trade journal, every loss can feel random. With one, patterns become visible. You may find that your losses cluster during the first minutes after the open, that you chase more after two wins, or that countertrend trades consistently fail to reach target.
Track more than profit and loss. Record the setup type, timeframe, market condition, entry quality, planned risk, actual exit, and whether you followed your rules. Screenshots before and after the trade are especially useful because they preserve context that a number cannot show.
Review a meaningful sample, not just the last two trades. Ten losses in a row can happen with a legitimate strategy, particularly if the win rate is modest and the reward-to-risk profile is favorable. But repeated rule-breaking is not variance. It is a process problem that needs a direct fix.
Build a Better Pre-Trade Decision Process
Before committing capital, reduce the chart to a few decisions: What is the trend? Where is the trade invalidated? What level confirms entry? Where is the next obstacle? How much can I lose if the idea fails?
Fast analysis should not mean rushed analysis. Tools such as ChartViews AI can help traders quickly identify trend direction, key support and resistance, and potential entry and exit zones from a chart. The decision still belongs to you, including whether the setup fits current market conditions and your risk rules.
The best trade setup is not the one with the most indicators or the most convincing social-media narrative. It is the one you can explain in a few sentences, size correctly, and exit without improvising. Build that standard, then let each trade be one measured outcome in a repeatable process.
Want a structured second read of your own chart? Run an analysis on ChartViews AI.
Educational content, not financial advice. Trading involves risk of loss.
 Money Circle Blog
 Trader Reflect Blog