Technical Analysis vs Chart Automation for Traders
A chart can look obvious after a move has already happened. The real test is identifying the trend, the decision level, and the invalidation point while price is still moving. That is where technical analysis vs chart automation becomes a practical trading question, not a debate about whether machines can replace traders.
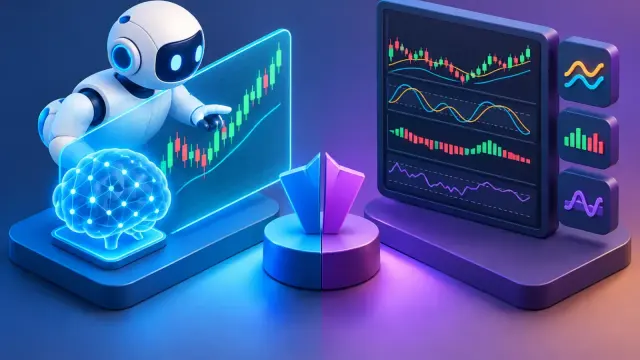
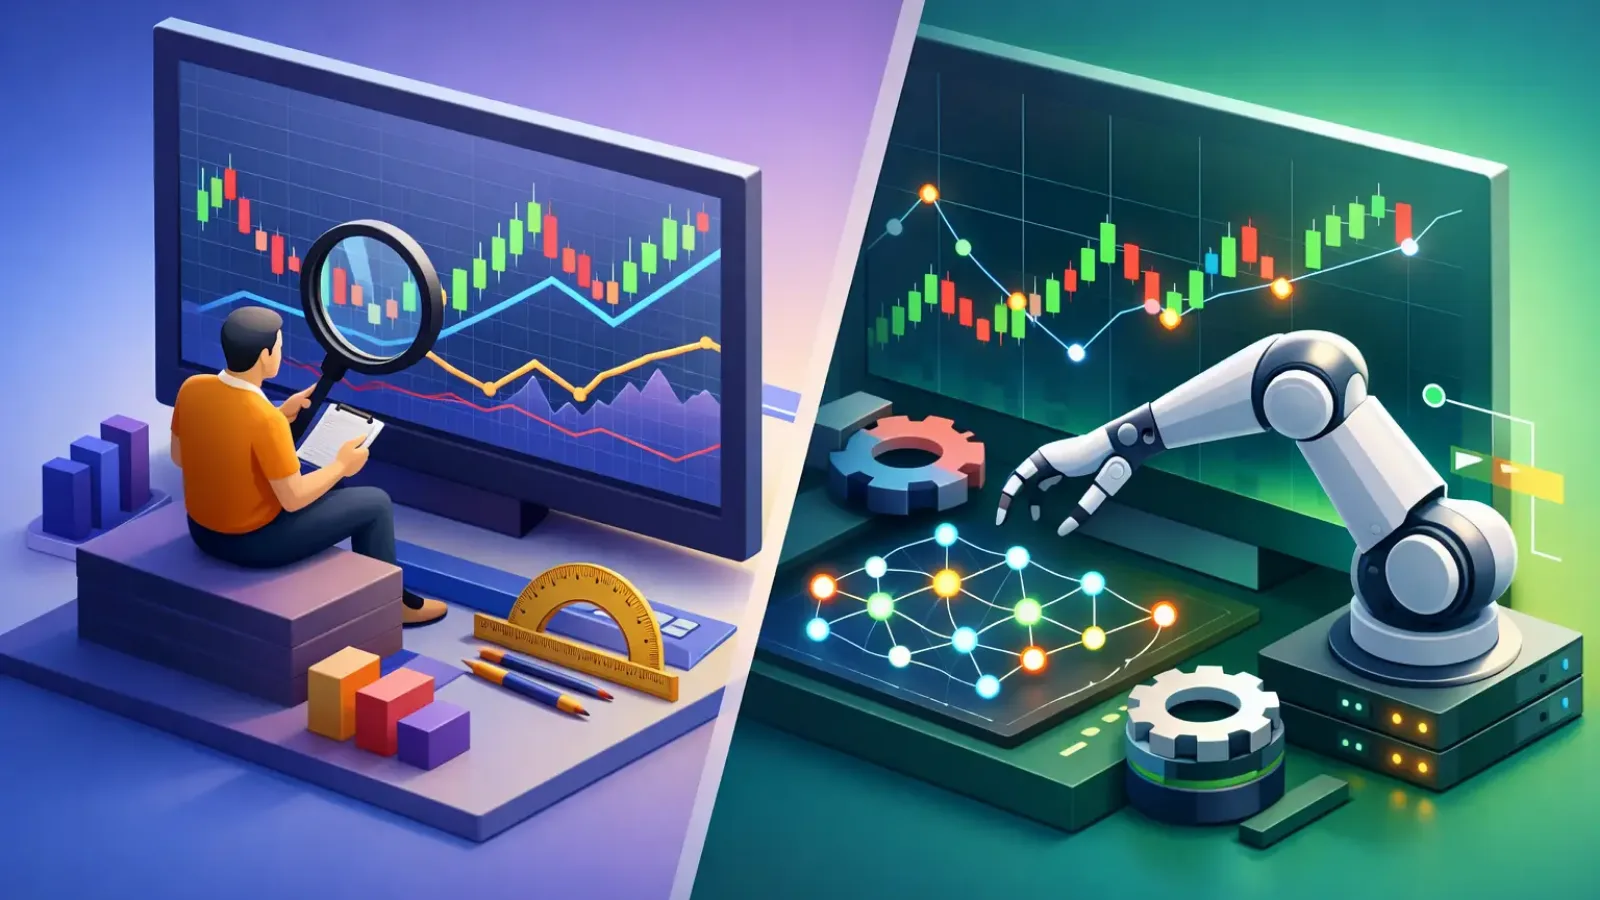
Manual chart reading builds market awareness. Chart automation reduces the time required to apply that awareness across more setups. Used well, they are not opposing methods. They are two parts of a faster, more disciplined review process.
What manual technical analysis does well
Technical analysis is the process of using price, volume, market structure, and indicators to assess probable market behavior. A trader may mark a prior swing high, identify a rising trendline, watch for a breakout retest, and decide whether the risk-to-reward profile supports a trade.
Its biggest advantage is context. A skilled trader can recognize that a support level is meaningful because it aligns with a higher-timeframe range, a round number, and a prior high-volume reversal. They can also see when a clean-looking pattern is less reliable because price is approaching major news, the market is choppy, or the broader trend is weak.
Manual analysis also forces ownership of the trade. When you draw levels and define the reason for entry yourself, you are more likely to understand where the idea is wrong. That matters when volatility increases and a position needs active management.
The cost is time and consistency. Reviewing charts across stocks, forex pairs, and crypto markets can turn into a long sequence of small judgments. One trader may see a breakout on a chart in the morning and call the same structure indecision later in the day. Fatigue, bias, and urgency can change the interpretation.
What chart automation changes
Chart automation uses software and AI to accelerate repetitive chart review. Depending on the tool, it can detect trends, identify support and resistance zones, recognize price structures, and surface potential entry, target, and exit areas from a chart.
The value is not that automation makes risk disappear. Markets remain uncertain, and no chart tool can know the next headline, liquidity event, or sudden change in sentiment. The value is speed and structure. Instead of starting every review from a blank chart, the trader begins with a clear technical read to evaluate.
For an active trader, that shift can be significant. A fast first-pass analysis helps answer the questions that often cause delay: Is price trending or ranging? Where are the nearest decision levels? Is there enough room to a target? What level would invalidate the setup?
ChartViews AI is built around this workflow. Upload a chart and receive instant AI-powered analysis of trend direction, key support and resistance, and potential entry and exit points. The trader still makes the decision, but the chart review starts with organized information rather than a manual hunt for every signal.
Technical analysis vs chart automation: the real trade-off
The central trade-off is control versus speed, but that description is incomplete. Manual technical analysis provides deeper involvement in the reasoning process. Automation provides a repeatable way to scan and structure that process quickly.
If you are learning how market structure works, manual chart work is essential. Drawing your own ranges, identifying higher highs and lower lows, and reviewing failed setups develops pattern recognition. Automation should not become a shortcut around understanding risk, position sizing, or the difference between a level and a guaranteed reversal.
If you already understand your approach but struggle to review enough charts consistently, automation becomes more valuable. It can reduce the friction between spotting a potential trade and testing it against your rules. That is especially useful for traders balancing markets, timeframes, and a full workday.
The right choice depends on the task. A long-term investor reviewing a handful of weekly charts may prefer a slower, manual process. A day trader monitoring several intraday instruments has more to gain from immediate level identification and structured confirmation. A beginner can use automated analysis as a learning aid, comparing the tool's read with their own chart markings rather than accepting every output without question.
Where automation helps most
Chart automation is strongest when the work is repetitive, visual, and time-sensitive. It can help traders organize a chart before they let emotion or a favorite market bias take over.
It is particularly useful for identifying obvious trend conditions and nearby support and resistance. Those levels often shape the trade plan. A long entry near overhead resistance may offer limited upside. A short setup directly above established support may have poor room to target. Seeing these constraints quickly can prevent forced trades.
Automation can also improve consistency between reviews. If your process begins with the same core questions every time, you are less likely to chase a candle simply because it is moving fast. The goal is not to eliminate discretion. It is to make discretion more deliberate.
There is another advantage: faster post-trade review. Save the chart, compare the automated read with your thesis, and assess whether the trade followed your plan. Over time, this can expose recurring errors, such as entering too close to resistance, ignoring a sideways market, or using stops that do not match the chart structure.
Where trader judgment still leads
An automated chart read is an input, not a trading mandate. The trader must decide whether the setup fits the current market environment, their strategy, and their risk limits.
Context is the first reason. A bullish structure on a five-minute chart may conflict with a strong daily downtrend. A breakout can be technically valid yet vulnerable to a scheduled earnings release or central bank decision. The chart can show levels, but the trader must decide whether the timing supports participation.
Risk is the second reason. Two traders can look at the same entry zone and make different valid decisions because their account size, holding period, and acceptable loss differ. Automation can identify an invalidation area, but it cannot choose your position size or determine what loss is appropriate for your plan.
Finally, traders need to recognize when not to trade. A chart may have clearly defined levels but still offer no compelling opportunity if the range is too narrow, volatility is erratic, or the potential reward does not justify the risk. Skipping a marginal setup is a performance decision.
A smarter workflow for faster chart decisions
Use automation to create a first technical read, then apply your rules before placing an order. This keeps speed from becoming impulsiveness.
Start with the chart and timeframe you actually trade. Review the automated trend assessment and the nearest support and resistance areas. Then compare those levels with the higher-timeframe structure. If the two timeframes conflict, reduce confidence or wait for clearer confirmation.
Next, define the trade in plain terms: the trigger that gets you in, the price level that proves the thesis wrong, and the target or management rule that makes the trade worthwhile. If you cannot state those three elements clearly, the setup is not ready.
Before execution, check the event calendar and liquidity conditions relevant to your market. A technically clean chart can change character quickly around news. Then size the position based on predetermined risk, not on how convincing the chart appears.
This process is short by design. The purpose of automation is not to add another layer of analysis paralysis. It is to get to a disciplined decision faster: take the planned trade, wait for confirmation, or pass.
The goal is better decisions, not more signals
The best use of chart automation is not constant trading. It is faster filtering. When every chart gets a structured review, weak setups become easier to reject and strong setups become easier to define.
Technical skill still matters. So do patience, risk control, and the ability to act only when a setup meets your standards. But you do not need to spend unnecessary time manually rebuilding the same chart analysis across every market.
Let automation handle the first pass. Keep judgment, risk, and execution in your hands. The edge is not a chart that tells you what to do. It is a process that helps you see the decision clearly enough to act with discipline.
Educational content, not financial advice. Trading involves risk of loss.
 Money Circle Blog
 Trader Reflect Blog