Support and Resistance Detection That Works
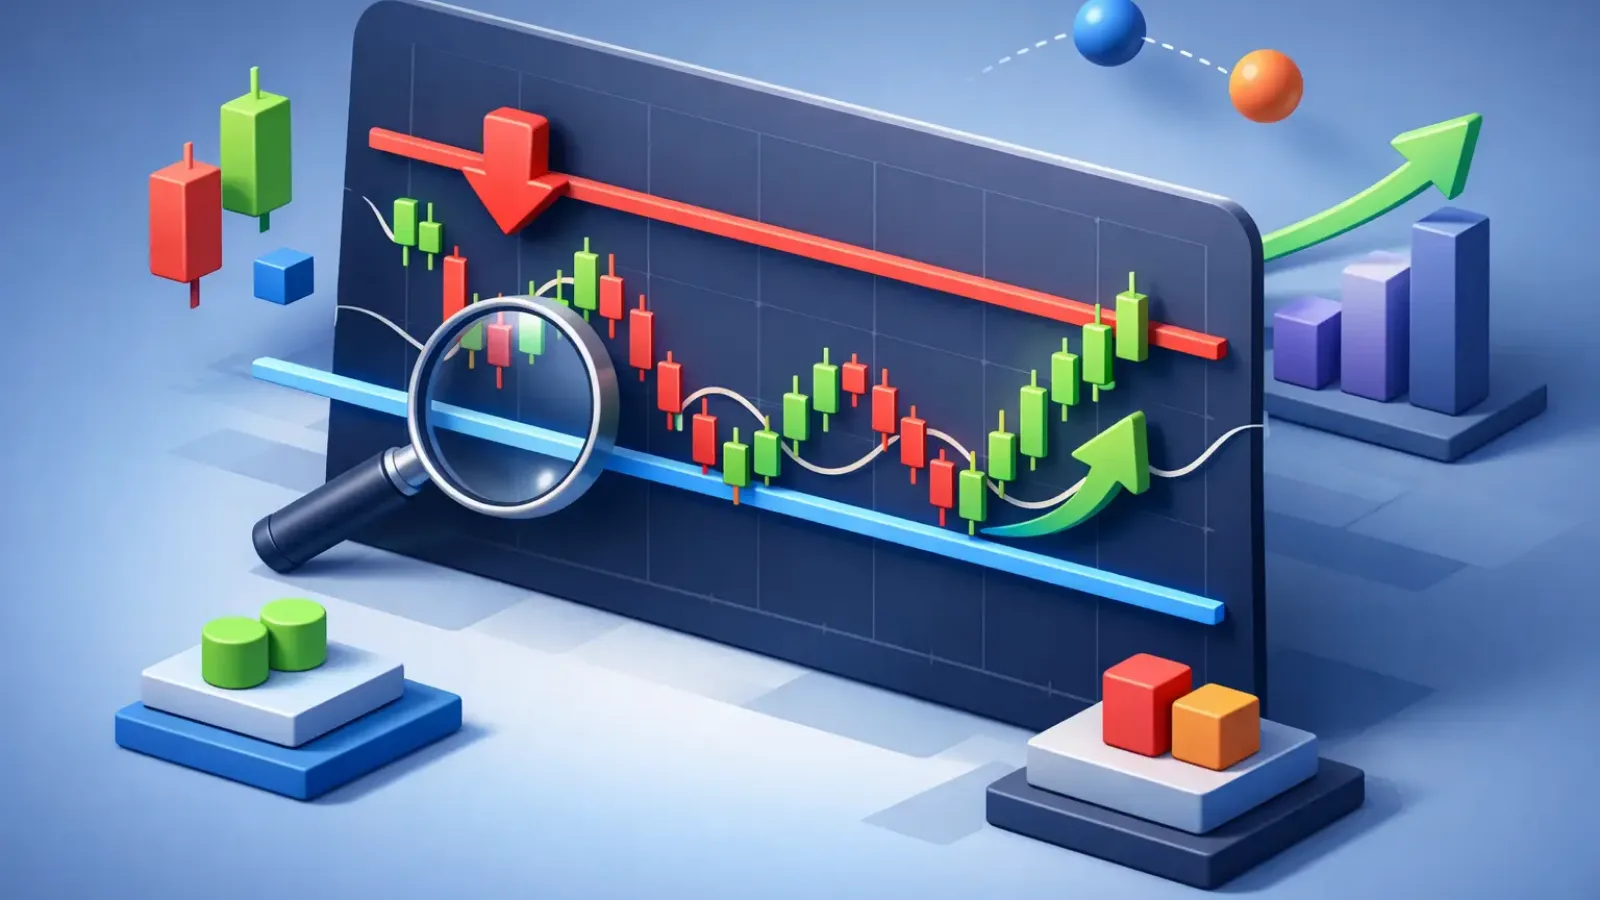
Most losing trades do not start with bad intent. They start with a chart that looked clear until price hit a level you did not respect. That is why support and resistance detection matters. If you cannot identify where buyers or sellers are likely to respond, your entries get late, your stops get sloppy, and your trade plan turns reactive fast.
For active traders, this is not a theory problem. It is a speed and consistency problem. You may know what support and resistance are, but spotting the right levels across multiple charts, timeframes, and market conditions is where performance breaks down. The goal is not to draw more lines. The goal is to find the levels that actually influence price.
What support and resistance detection is really doing
At a practical level, support and resistance detection is the process of locating price zones where market participants have repeatedly changed behavior. Support is where buying pressure has previously absorbed selling. Resistance is where selling pressure has previously capped advances. But traders often make the mistake of treating these as exact prices instead of areas.
That distinction matters. Price rarely turns at a perfect line. It reacts inside a zone, often with brief breaks, retests, and failed moves before direction becomes clear. If your chart review expects precision down to the cent or the pip, you will mark too many false breaks and miss the broader structure.
The real job of level detection is to answer three questions fast. Where is price likely to pause? Where is it likely to reverse? And where is your current trade idea likely to lose momentum? If a level cannot help you make one of those decisions, it is probably not worth emphasizing.
Why manual support and resistance detection goes wrong
Most traders can identify obvious highs and lows. The problem shows up when the chart gets messy. A strong trend leaves behind minor pullbacks, overlapping candles, and intraday noise that all look relevant in the moment. Suddenly one clean chart becomes five competing interpretations.
This is where inconsistency creeps in. On Monday you mark the swing high. On Tuesday you mark the wick. On Wednesday you use the closing basis instead. Nothing about your system changed except your judgment, and that is enough to change the trade.
Timeframe conflict makes this harder. A level that looks critical on the 15-minute chart may be insignificant on the 4-hour chart. A breakout on a lower timeframe can run directly into higher timeframe resistance and fail almost immediately. Traders who only look at one timeframe often confuse local movement with meaningful structure.
Emotion adds another layer. Once you want a setup to work, it becomes easy to redraw levels around your bias. That is one reason structured analysis matters. It reduces the temptation to make the chart fit the trade.
How to identify levels that matter
Strong levels usually share a few traits. They have been tested more than once. They caused a visible reaction in the past. They align with swing highs, swing lows, consolidation edges, or breakout retests. And they stand out across more than one timeframe.
A level gains credibility when price has respected it under different conditions. For example, a prior resistance zone that later acts as support carries more weight than a random intraday bounce. The market is showing memory. That memory is what traders are trying to capture.
Context matters just as much as the line itself. In a clean uptrend, support levels tend to matter more because traders are looking for continuation entries. In a range, both boundaries matter because reversals are more common. In a high-volatility environment, price may overshoot levels more often, which means wider zones and more patience are needed.
Volume can help, but it is not always necessary. A sharp rejection candle at a prior high can be meaningful even without volume confirmation. On the other hand, a level that breaks on strong participation is less likely to hold on the next test. There is no single rule that works every time. The best read comes from stacking signals, not forcing certainty from one clue.
Support and resistance detection across timeframes
If you want cleaner decisions, start with the higher timeframe and work down. The daily or 4-hour chart usually reveals the structural levels that institutions and swing traders care about. Then the 1-hour or 15-minute chart helps refine execution.
This approach solves a common problem. A lower timeframe chart can make every move feel urgent. Higher timeframe levels restore perspective. You can see whether price is breaking into open space, bouncing inside a range, or pressing into a major zone where reversals are more likely.
The best entries often come from this alignment. Suppose the daily chart shows price sitting near a key support area, while the 15-minute chart forms a reversal pattern with a clear invalidation point. That is a far more disciplined setup than buying because one candle looked strong in isolation.
What traders should avoid when marking levels
The first mistake is overmarking. If your chart looks like a barcode, you are not detecting structure. You are documenting every place price hesitated. Too many levels reduce clarity and create hesitation at the exact moment you need conviction.
The second mistake is trusting a single touch. One reaction can be random. Repeated reactions suggest the level is being watched. That does not guarantee a future bounce or rejection, but it does make the area more relevant.
The third mistake is ignoring regime. A resistance level inside a quiet range behaves differently from resistance during a news-driven breakout. Levels do not operate in a vacuum. Momentum, volatility, and session timing all affect how price responds.
The fourth mistake is treating broken support or resistance as finished. Often the better opportunity comes after the break, when price retests the level from the other side. Former resistance can become support. Former support can become resistance. Traders who only focus on the first move often miss the cleaner second one.
Why AI improves support and resistance detection
This is where speed changes the game. Good chart reading is not just about knowing what support and resistance mean. It is about identifying the most actionable levels quickly and consistently, without second-guessing every candle.
AI-powered support and resistance detection helps by reducing subjective drift. Instead of manually scanning chart after chart and trying to decide which levels matter most, traders can use structured analysis to surface key zones, trend context, and likely reaction areas in seconds. That saves time, but more importantly, it makes chart review more repeatable.
For beginner and intermediate traders, that repeatability builds confidence. For experienced traders, it acts as fast confirmation. In both cases, the edge is not that AI makes the decision for you. The edge is that it organizes the chart faster, so you can focus on execution.
A platform like ChartViews AI fits this workflow well because it turns a chart upload into instant technical analysis. That matters when you are reviewing multiple setups, switching between markets, or trying to stay disciplined under time pressure. Faster analysis is only useful if it improves decision quality. Structured level detection does exactly that when it is used as a decision support tool, not a substitute for risk management.
Turning detected levels into trade decisions
A level on its own is not a trade. It becomes useful when it connects to a plan. If price approaches support, are you looking for a bounce, a breakdown, or a wait-and-see reaction? If price reaches resistance, are you taking profit, fading the move, or waiting for a breakout and retest?
Your answer should depend on structure and confirmation. In trending markets, continuation trades off support often make more sense than aggressive fades at resistance. In ranging markets, reversal trades at the boundaries can work well, but only if the range is still intact. If price is compressing near resistance with strong momentum, shorting the first touch may be lower quality than waiting for proof of rejection.
This is also where stop placement gets cleaner. Good support and resistance detection helps you define where your idea is wrong. Not emotionally wrong. Structurally wrong. That creates tighter trade plans and better position sizing.
No level is perfect. Some will fail cleanly. Others will hold after a messy sweep that stops out early traders. The goal is not prediction. The goal is to improve the odds that your entry, exit, and invalidation are tied to real market structure instead of guesswork.
The traders who improve fastest are usually not the ones drawing the most lines. They are the ones who can identify the few levels that matter, act on them with discipline, and move on when the market proves them wrong. Better support and resistance detection does not remove uncertainty. It gives you a stronger framework for handling it.
Educational content, not financial advice. Trading involves risk of loss.
 Money Circle Blog
 Trader Reflect Blog