AI Chart Analysis vs Indicators
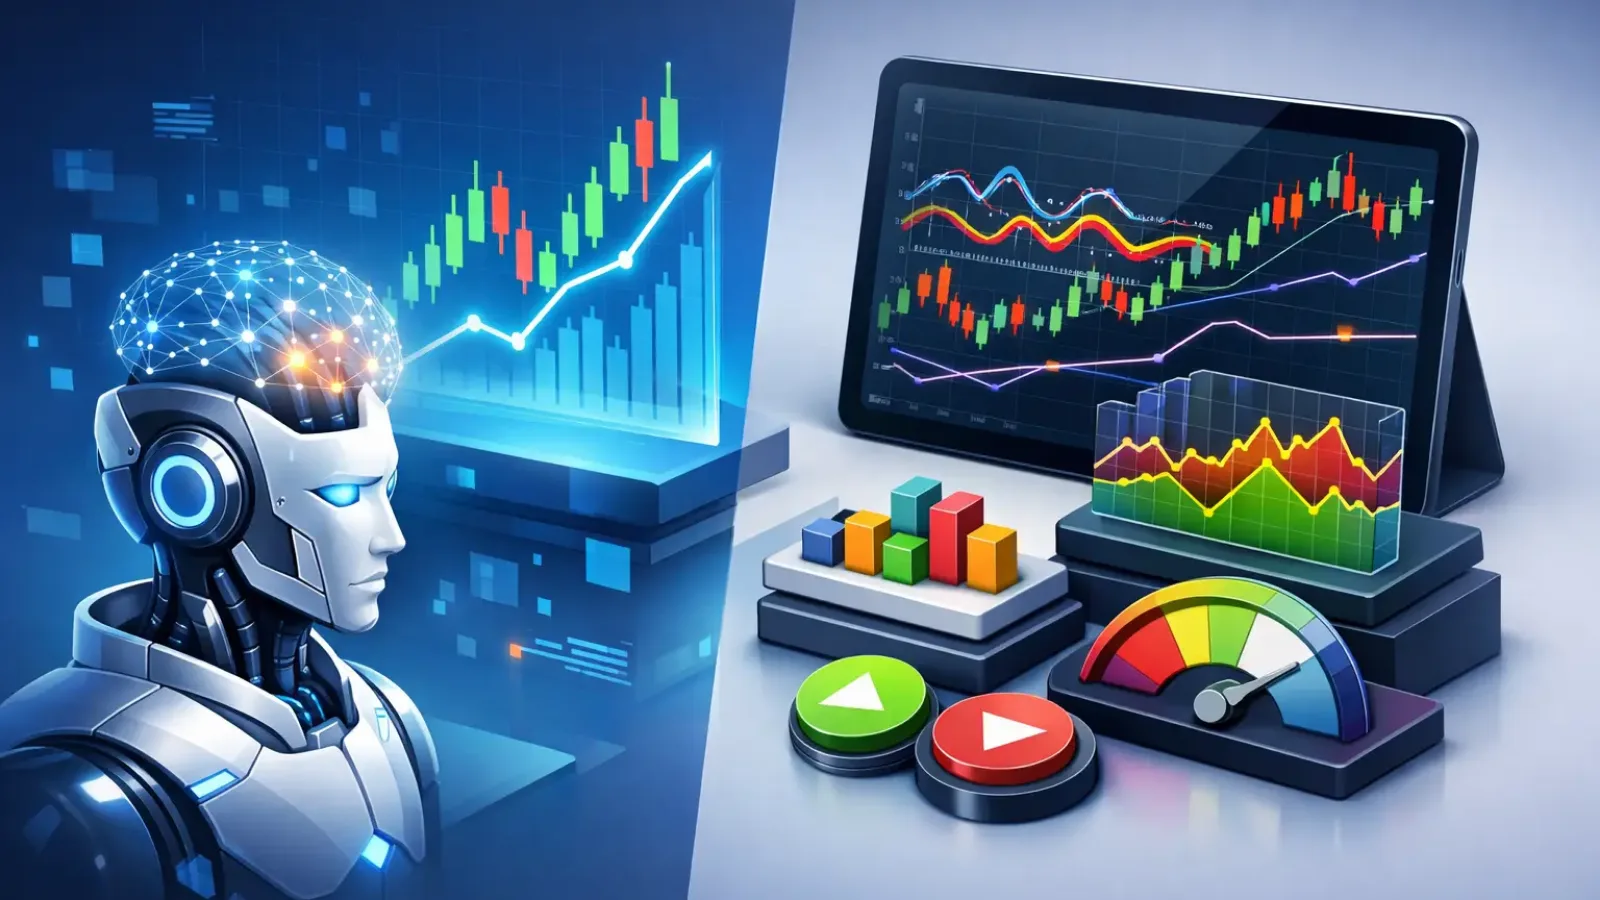
You can spot the problem in under a minute: one chart, five indicators, three conflicting signals, and no clean decision. That is where the real debate around ai chart analysis vs indicators starts. Traders are not choosing between two theories. They are choosing between two ways of getting to a trade idea faster, with more structure and less second-guessing.
Indicators have been part of technical analysis for decades because they give traders a repeatable framework. Moving averages smooth price. RSI flags momentum extremes. MACD helps track trend shifts. The appeal is obvious - they are familiar, measurable, and easy to add to almost any platform.
AI chart analysis approaches the same chart from a different angle. Instead of asking a trader to stack tools and interpret them manually, it reads the chart visually and structurally. That means trend context, support and resistance, breakout zones, and possible entry and exit areas can be identified in one pass. For active traders, the value is not novelty. It is speed, consistency, and less friction between seeing a setup and evaluating it.
AI chart analysis vs indicators: the real difference
The biggest difference is not accuracy in some abstract sense. It is workflow.
Indicators are formula-based outputs built from price, volume, or volatility data. They take raw market data and convert it into signals based on predefined rules. That makes them useful, but also limited. They only tell you what the formula is designed to measure. A moving average crossover can suggest trend direction, but it does not explain whether price is also sitting at a major resistance level or whether the broader chart structure looks weak.
AI chart analysis works more like a structured chart review. It evaluates the full visual setup rather than one isolated calculation. A trader can upload a chart and get analysis that highlights trend direction, key levels, and possible trade zones without manually interpreting every candlestick and pattern. That changes the job from building the analysis piece by piece to validating and acting on a clearer read of the market.
This matters most when time is tight. If you trade multiple watchlists, multiple time frames, or multiple markets, indicator-heavy workflows can slow you down. You are still doing the interpretation yourself. AI compresses that review process.
Why indicators still matter
There is a reason indicators have lasted. They are simple, objective, and familiar.
For beginners, indicators create structure. A trader who does not yet trust their eye can use RSI, VWAP, or a 20-day moving average to anchor decision-making. For experienced traders, indicators can add confirmation. A breakout above resistance with rising volume and trend alignment often feels stronger than price action alone.
Indicators also help standardize a process. If your rules are based on fixed conditions, they are easier to test and easier to repeat. That is valuable in trading, where inconsistency can cost real money.
But indicators have a built-in trade-off. Most are lagging because they are derived from past data. Even momentum tools that feel responsive are still reacting to what price has already done. The more indicators a trader adds, the more likely they are to create overlap, noise, and delayed entries.
That is where many retail traders get stuck. They are not short on tools. They are short on clarity.
Where AI chart analysis has the edge
AI chart analysis is strongest when the trader's bottleneck is interpretation.
A chart can contain trend structure, failed breakouts, compression near resistance, clean support retests, and momentum loss all at once. Indicators may reflect parts of that picture, but they often miss the broader context. AI can organize that context into a faster, more usable read.
This is especially useful for traders who scan many setups per day. Instead of manually checking each chart for levels, trend quality, and entry logic, they can move straight to a structured analysis. That reduces fatigue and makes decision-making more disciplined.
It also lowers the barrier for traders who know what they want to see but struggle to identify it consistently. Support and resistance are a good example. Many traders understand the concept, but drawing levels cleanly and confidently is another matter. AI can make that process more repeatable.
For beginners and intermediate traders, that kind of structure can cut down on hesitation. For experienced traders, it can function as a fast second opinion.
AI chart analysis vs indicators for trade execution
Execution is where the gap becomes practical.
Indicators often help traders answer narrow questions. Is momentum overextended? Is trend strength increasing? Is volatility expanding? Those are useful inputs, but they do not automatically turn into a trade plan.
A trade plan needs context. Where is the invalidation? Is price approaching a reaction zone? Is this breakout happening into overhead supply? Is the risk-reward still attractive after the move has already started?
AI chart analysis is better suited to those questions because it is not locked into one metric. It can frame the chart in a way that supports action, not just observation. That does not mean every AI-generated read is perfect. It means the output is closer to the decision a trader actually needs to make.
In practical terms, indicators often support analysis. AI can accelerate it.
The limits of both approaches
Neither side solves trading on its own.
Indicators can create false confidence because they look precise. A clean crossover or oversold reading does not guarantee a good trade. Without chart context, indicator signals can be misleading, especially in choppy or news-driven markets.
AI chart analysis has its own limits. It can speed up review and improve structure, but it should not replace judgment. Traders still need to understand market conditions, position sizing, and execution risk. A strong-looking setup can fail because of liquidity, timing, or macro events that no chart-only process fully captures.
This is why the best comparison is not old versus new. It is narrow signals versus broader interpretation.
If your main issue is signal overload, adding more indicators will probably not fix it. If your main issue is having no framework at all, a few well-chosen indicators can still help. It depends on where your process breaks down.
The best use case is often a hybrid
For many active traders, the strongest setup is not ai chart analysis vs indicators as an either-or decision. It is AI first, indicators second.
That sequence makes sense because it mirrors how strong discretionary analysis works. First, understand the chart. Then confirm with specific tools if needed.
A trader might use AI to identify trend direction, support and resistance, and possible breakout or pullback zones. After that, one or two indicators can help confirm momentum, volume behavior, or mean reversion risk. The chart stays readable. The process stays fast. And the trader avoids building a system that depends on ten separate signals lining up at once.
This hybrid approach also improves discipline. When the chart structure is clear first, indicators are less likely to be misused as emotional justification for a trade you already wanted to take.
That is a common problem with manual workflows. Traders often add indicators until one agrees with their bias. A structured AI review can reduce that tendency by putting the chart context upfront.
Which one is better for your trading style?
If you are highly systematic and already trade fixed rules with a small set of indicators, you may not need to replace that process. Indicators can continue to do their job well.
If you are discretionary, trade multiple assets, or often lose time trying to interpret chart structure, AI chart analysis will likely deliver more immediate value. It can shorten review time, improve consistency, and help you get to the key levels faster.
If you are newer to trading, AI can also flatten the learning curve. Instead of guessing where support and resistance should be or whether a trend is still intact, you start with a structured read and build confidence from there. Platforms built around instant chart interpretation, such as ChartViews AI, are designed for exactly that use case.
The better question is not which method sounds smarter. It is which one helps you make cleaner decisions with less hesitation.
Trading performance usually does not break because traders lack data. It breaks because their process is too slow, too cluttered, or too inconsistent. Indicators can still play a role, but when chart review becomes the bottleneck, AI has a clear advantage. The traders who move fastest are often the ones who see the chart clearly before they ever look for extra confirmation.
Educational content, not financial advice. Trading involves risk of loss.
 Money Circle Blog

 Trader Reflect Blog