Support and Resistance on EUR/USD: A Step-by-Step Guide
Support and resistance is the first tool most forex traders learn and the one they most often apply badly. The usual problem is not that levels do not work. It is that they are drawn as thin lines, in too many places, on whichever chart happened to be open. A level you can trust has a reason, and you can explain that reason in a sentence.
This guide shows how to find support and resistance on EUR/USD, step by step, with a hypothetical example. The prices are invented round numbers chosen to illustrate the method, not a view of where the pair will trade. The article is educational, not advice.
What support and resistance are, in one paragraph
Support is an area where buyers have repeatedly stepped in and stopped a fall. Resistance is an area where sellers have repeatedly stopped a rise. They are zones of past reaction, not guarantees. When price breaks through one, it can later return to test it from the other side, which is why old resistance often becomes new support and the reverse. If you want the theory, read what support and resistance are. Here we go straight to the method.

Step 1: start on the daily chart
Open EUR/USD on the daily timeframe and scroll back several months. Higher timeframes carry more weight, because more traders and more time have gone into those prices. Begin here even if you trade on a one-hour chart. The levels you mark on the daily chart are the ones the one-hour chart will respect or ignore.
Zoom out until you can see the whole range of the past few months without the candles being too small to read. Do not look at indicators yet. Price alone will do.
Step 2: mark the obvious swing highs and lows
Find the clear turning points: peaks that price rose to and then fell from, and troughs that it fell to and then rose from. A swing high is a candle with lower highs on both sides. Mark only those that stand out when you squint. If you have to search for a turning point, it probably does not matter.
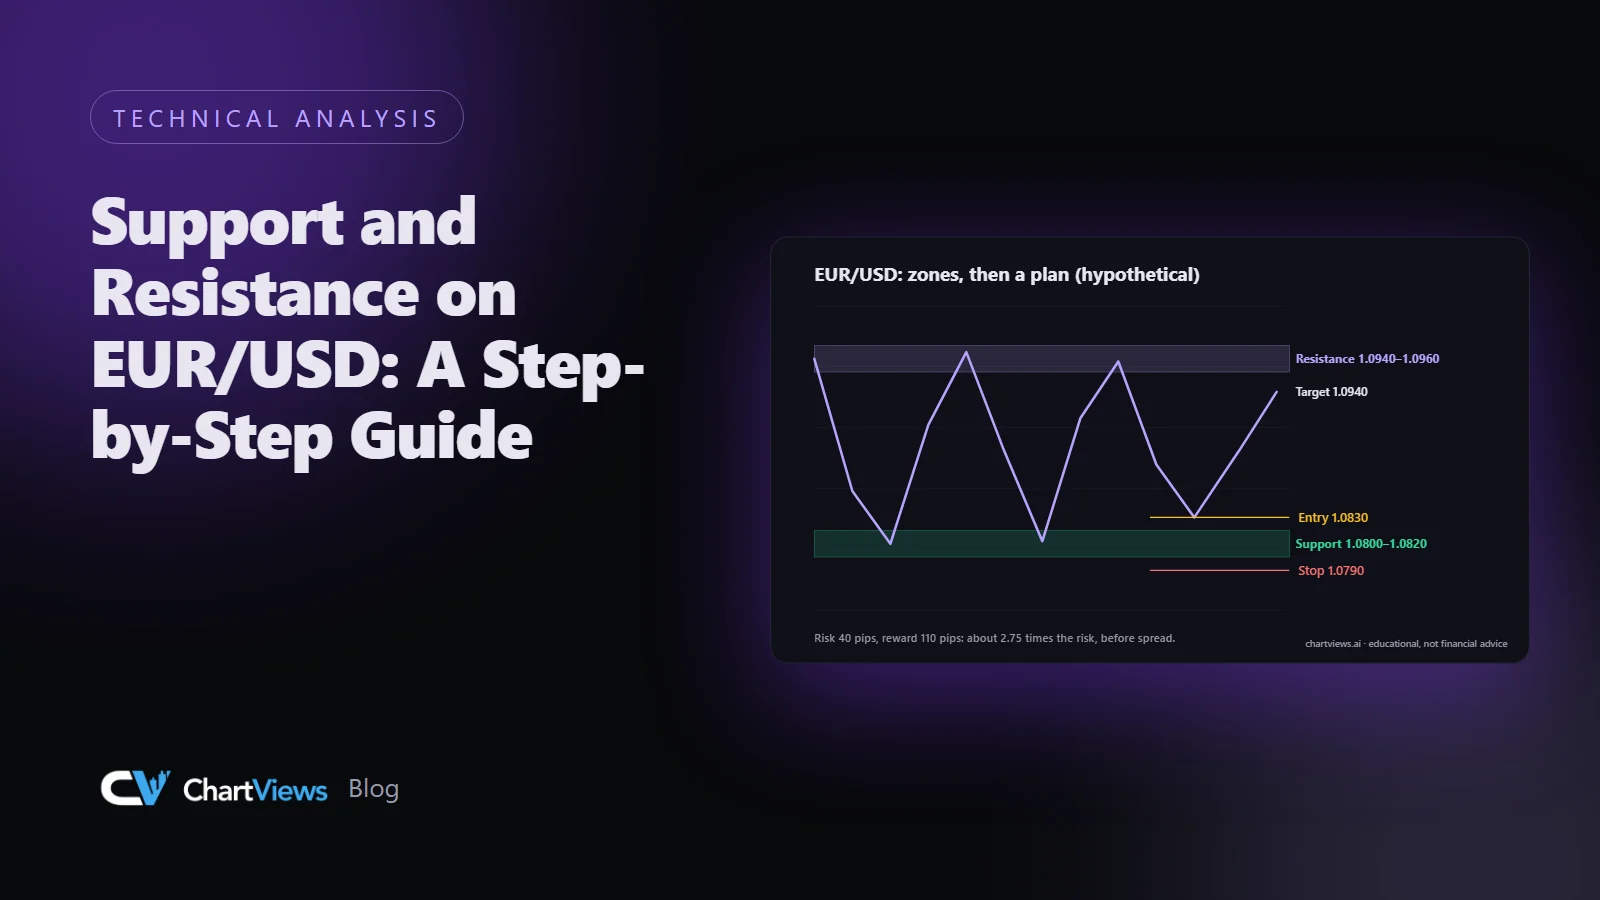
In our hypothetical example, imagine EUR/USD has made peaks near 1.0950 three times in four months, and troughs near 1.0800 twice. Those two areas are your first candidates.
Step 3: turn lines into zones
Price rarely reverses at exactly the same decimal. One peak might be at 1.0948, another at 1.0957, a third at 1.0944. Instead of choosing one number, draw a band that covers the bodies and most of the wicks of those reactions. In this example, the resistance zone might be 1.0940 to 1.0960, about twenty pips wide.
Zones are also more honest about uncertainty. A trade near a zone is a trade near an area where reactions have happened, not at a magic price. Our guide to support and resistance detection that works goes into how to size a zone.
Step 4: count the touches and note how price left
For each zone, count the number of distinct times price reached it and note what happened next. A strong reaction, a rally of many pips away from the zone, tells you the level mattered. A weak reaction, such as a few candles of hesitation, tells you less.
Two or three clear reactions are a good sign. Beyond that, be cautious: every touch can also wear a level down, and a zone that has been tested many times is sometimes closer to breaking. There is no rule that says either; it is a judgement you make with the chart in front of you.
Step 5: add the round numbers and the previous extremes
Traders pay attention to round figures such as 1.0900 and 1.1000, and to the high and low of the previous week and month. If a zone you found in Step 3 lines up with one of these, it carries more reasons. If a round number sits in the middle of nowhere, with no reaction in the history, you can ignore it.
Keep the total number small. A chart with twelve zones tells you nothing. A useful daily chart has three to five zones around the current price, and that is plenty.
Step 6: check for role reversal
Look for places where a level changed jobs. In the hypothetical example, imagine price broke above 1.0960 in the past, pulled back to 1.0950 and held there before rising. That area, once resistance, has acted as support. Role reversal is one of the more reliable pieces of evidence that a zone is real, because both buyers and sellers have acted on it.
Also look at what happened when a zone failed: did price close beyond it, or only wick through it? A close beyond a zone is a stronger signal than a spike. Our article on what causes false breakouts covers the difference.
Step 7: move down a timeframe
Now open the four-hour chart. Check that the daily zones show up there as areas of reaction, and look for smaller zones inside them. On the one-hour chart you can then refine where, inside the daily zone, price is most likely to show its hand. The higher timeframe gives the map and the lower timeframe gives the detail. See multi timeframe analysis for how to assign each timeframe a job.
Step 8: turn zones into a plan
Levels are only useful if they change what you do. A simple, rule-based way to use them:
- The scenario. Write one sentence: "If price pulls back into 1.0800 to 1.0820 and shows a rejection on the four-hour chart, I will look for a long."
- The stop. Place it beyond the zone, beyond the wicks, where the idea would be invalid. If that stop is far away, the position is smaller, not the stop tighter. See how to set a stop loss.
- The target. The next zone in the direction of the trade, with room to run.
- The check. Compute reward against risk. If the next zone is too close, the trade may not be worth taking.
For example, a long from 1.0830 with a stop at 1.0790 risks 40 pips. A target at the next zone, 1.0940, offers 110 pips, about 2.75 times the risk. These numbers are hypothetical and only show how the arithmetic fits together. See risk-reward ratio explained for the full method.
Common mistakes
Drawing lines instead of zones. A thin line invites false precision, and you will be stopped out by a wick that a zone would have absorbed.
Too many levels. If every part of the chart has a level, none of them means anything.
Using only a low timeframe. Levels from a five-minute chart vanish quickly. Start on the daily chart.
Ignoring the trend. In a strong downtrend, support tends to fail more often than it holds. Check the direction of the higher timeframe before you buy a support zone.
Never updating. Levels age. Review them weekly, remove the ones price has left far behind, and add new ones.
Forgetting events. A scheduled release can drive price straight through a clean zone. Check the economic calendar before relying on any level.
A weekly routine
Spend ten minutes each weekend: open the daily chart, delete last week's zones that no longer apply, mark any new swing points, and write the three to five zones that matter into your journal. During the week, only look for trades near those zones. This keeps you from chasing candles in the middle of nowhere.
Where an AI read can help
Zone-finding is one of the tasks a structured chart reading can speed up. When you upload an EUR/USD chart to ChartViews AI, it returns trend context, candidate support and resistance areas and possible scenarios, which you can compare against your own marking. Treat it as a second opinion on the same chart, and check each level against the chart yourself. Learn what the output contains on the features page.
Want a structured second read of your own EUR/USD chart? Run an analysis on ChartViews AI.
Educational content, not financial advice. Trading involves risk of loss.

 Money Circle Blog
 Trader Reflect Blog