Chart Scanner vs Manual Analysis for Traders
A five-minute chart review can become a two-hour search when every ticker demands a fresh read. That is the real decision behind chart scanner vs manual analysis: not whether technology can replace a trader, but whether your process can find quality setups fast enough to act on them with discipline.
For active traders, speed matters. So does context. A scanner can surface candidates across a broad market in seconds, while manual chart work can reveal the nuances that a preset screen may miss. The strongest workflow uses each method for what it does best.
What a Chart Scanner Does Well
A chart scanner filters a large universe of stocks, forex pairs, crypto assets, or other markets against defined criteria. Depending on the tool, those criteria may include price above a moving average, unusual volume, a breakout above a recent high, RSI conditions, volatility, or a specific candlestick pattern.
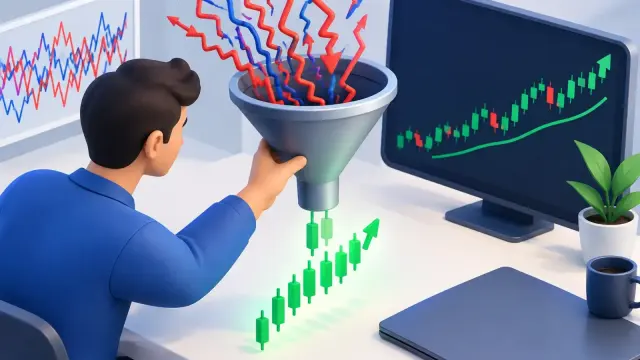
Its primary advantage is coverage. No trader can manually review hundreds of charts with equal attention before the opening bell or during a fast-moving session. A scanner reduces that universe to a manageable watchlist. Instead of asking, “What should I look at?” you begin with assets that already meet a condition relevant to your strategy.
That speed has practical value. A breakout trader can scan for stocks clearing resistance with volume. A swing trader can screen for pullbacks into an uptrend. A crypto trader can identify pairs moving sharply beyond their recent range. The scanner does not create the trade thesis, but it prevents good candidates from being buried in a market too large to watch manually.
Scanners also improve consistency. When your rules are explicit, you are less likely to chase a symbol simply because it is trending on social media or because a single candle looks exciting. The scan becomes a first filter based on conditions you have already decided matter.
Where Scanners Fall Short
A scanner sees what it is programmed to measure. That is useful, but it is also the limitation.
A price above a moving average can be bullish, or it can be extended after several oversized candles and due for a pullback. A breakout can be a clean continuation setup, or it can be a false move directly into a higher-timeframe resistance zone. A high-volume signal can indicate strong participation, but it can also reflect panic, news risk, or distribution.
Most scanners also depend on fixed rules. They can identify that an asset is near a 20-day high, but they may not fully interpret whether that level is part of a tight base, a broad choppy range, or a late-stage rally. They can flag a crossover, but not always the quality of the price structure around it.
This is why a scan result should never be treated as a buy or sell instruction. It is a candidate list. The chart still needs review, and the trade still needs a defined invalidation level, position size, and risk plan.
The Strength of Manual Chart Analysis
Manual analysis gives traders the context behind the signal. When you study a chart directly, you can evaluate market structure, trend quality, support and resistance, momentum, volume behavior, and the relationship between multiple timeframes.
That context is where many trade decisions are won or lost. Consider two assets that both appear on a breakout scan. The first is moving out of a tight consolidation above a clearly defended support level. The second is breaking a level after a vertical run and is approaching resistance from a weekly chart. The scanner may rank them similarly. A disciplined chart review should not.
Manual work also helps traders build conviction. You can see whether a pullback is orderly or aggressive, whether buyers are defending a key level, and whether the entry leaves enough room to the next resistance area. Those observations make it easier to define a trade plan before entering rather than reacting after the position is open.
For developing traders, manual analysis is essential education. You learn to recognize how trends behave, why levels matter, and what separates a clean setup from a mediocre one. Skipping that learning entirely can turn any tool into a source of dependency.
The Cost of Doing Everything Manually
The problem is not that manual analysis lacks value. The problem is that it does not scale well.
Reviewing one chart carefully is manageable. Reviewing 30 charts across several timeframes before work, then monitoring a live market, is where fatigue and inconsistency appear. Traders start rushing. They overlook levels. They interpret similar patterns differently depending on their mood, recent wins, or fear of missing out.
Manual chart review can also create analysis paralysis. More indicators, more timeframes, and more possible interpretations do not automatically produce a better decision. At some point, additional review adds noise instead of clarity.
The best traders are not necessarily the ones who stare at charts the longest. They are the ones with a repeatable process for finding opportunities, validating them, and passing when the setup does not meet the standard.
Chart Scanner vs Manual Analysis: The Better Workflow
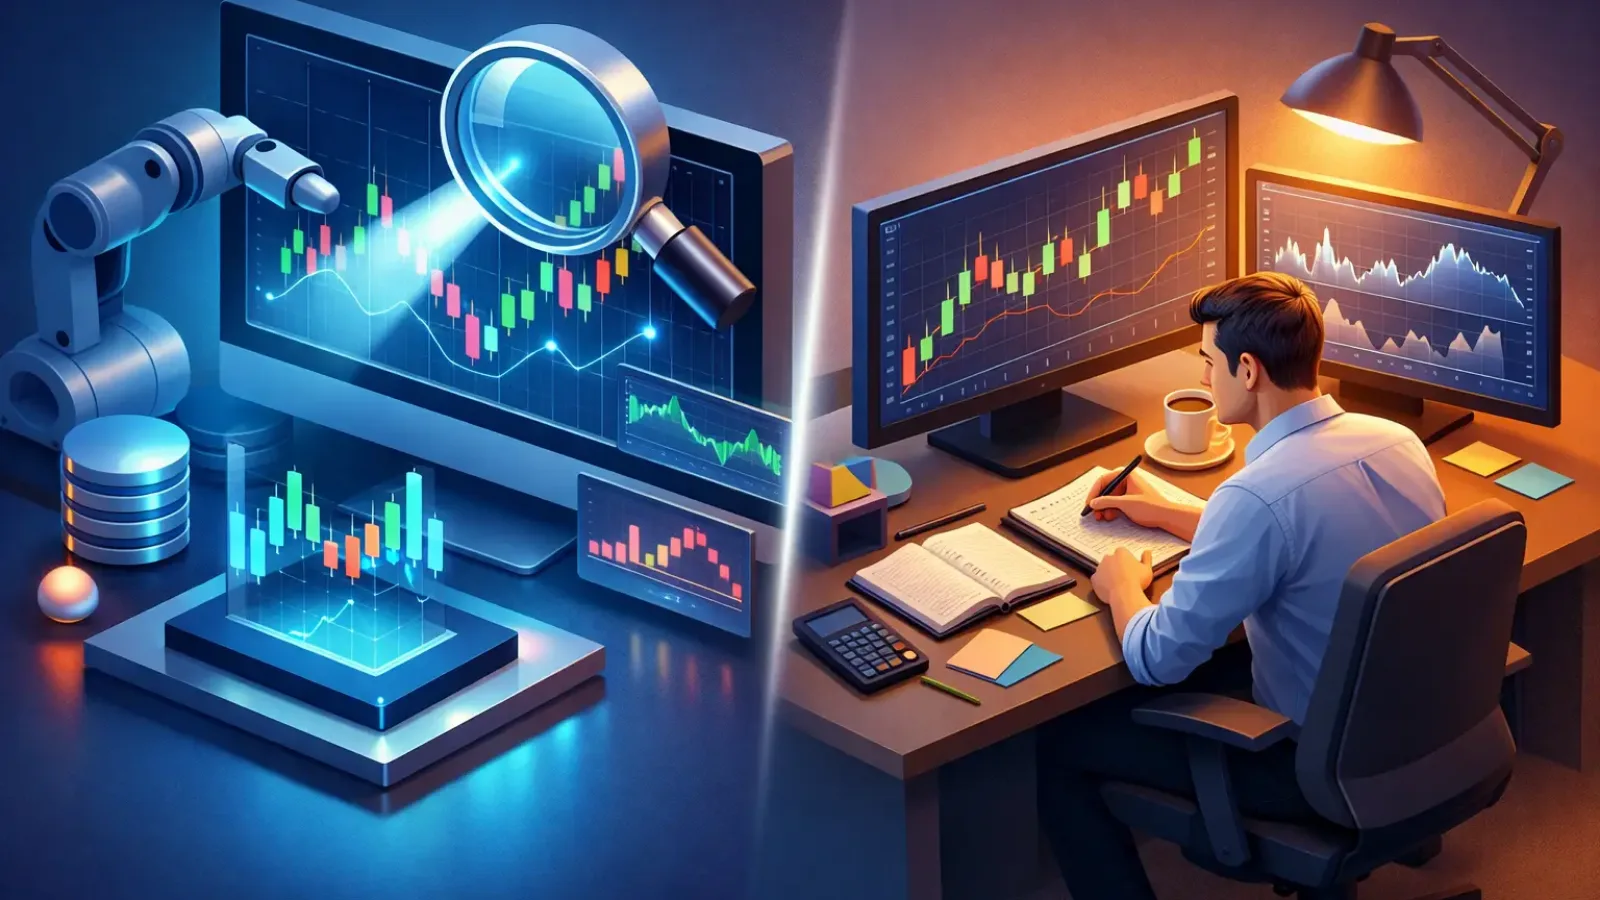
The most effective answer is usually not scanner or manual analysis. It is scanner first, manual confirmation second.
Use a scanner to narrow the market based on your strategy. Then use structured chart analysis to assess trend direction, key support and resistance levels, possible entry areas, invalidation points, and realistic targets. This sequence protects your time without removing your judgment.
For example, a day trader might scan for relative volume and strong premarket movement. From there, manual review determines whether price is holding above a meaningful level, whether the range offers a clean risk-to-reward setup, and whether the move is already too extended to chase. A swing trader might scan for price reclaiming a major moving average, then inspect daily and weekly structure before planning an entry.
The key is to assign each stage a job. The scanner finds possibilities. Analysis decides whether a possibility deserves capital.
When AI Chart Analysis Adds Value
AI-powered chart interpretation can make the confirmation stage faster and more structured. Rather than manually starting from a blank chart every time, traders can use AI to identify trend direction, relevant support and resistance zones, and potential entry and exit areas from the chart image itself.
That is especially useful when time is limited or when you want a second, consistent read on a setup. An AI analysis tool can help reduce the friction between seeing a chart and building a trade plan. It can also support newer traders who are still learning how to organize a technical review.
ChartViews AI is designed for this part of the workflow. Upload a chart, receive instant AI-powered analysis, and use the output to review trend, key levels, and possible trade scenarios with more structure. The goal is not blind automation. It is faster chart interpretation and more disciplined decision support.
AI still requires trader oversight. It may not know your account size, risk tolerance, exposure in correlated positions, upcoming news, or the rules of your specific strategy. It can improve the quality and speed of your chart review, but it cannot make risk management optional.
Build a Process You Can Repeat
A practical chart-review process should be simple enough to follow when markets are moving quickly. Start with a scan or focused watchlist. Review the higher timeframe to establish trend and major levels. Then move to your execution timeframe and identify where the trade is valid, where it fails, and where you would take profit.
Before entering, ask a few direct questions: Is the trend clear? Is price near a meaningful level? Is the entry late or well-positioned? Is the stop level logical? Does the potential reward justify the risk? If the answer is unclear, the setup may not be ready.
Keep a record of which scan signals and chart structures actually perform best for you. Over time, this turns general tools into a personalized system. You may find that a scanner is excellent for generating ideas but weak for certain market conditions, or that your best trades come from only one or two repeatable patterns.
Choose Speed Without Giving Up Judgment
A chart scanner saves time and expands market coverage. Manual analysis supplies the context that fixed criteria cannot fully capture. AI-assisted chart review can close the gap by turning a fast chart check into structured technical insight.
The edge is not in choosing one method and rejecting the other. It is in building a process where technology handles the search, your chart review tests the setup, and your risk rules make the final decision. The next chart you review does not need more indicators or more screen time. It needs a clearer process.
Educational content, not financial advice. Trading involves risk of loss.
 Money Circle Blog
 Trader Reflect Blog