What Is Price Confluence in Technical Trading?

A chart can offer dozens of reasons to enter a trade. The problem is that one signal alone is often weak. What is price confluence? It is the point where multiple independent technical factors identify the same price area as meaningful. For active traders, that overlap can turn a vague setup into a defined decision zone with clearer entries, stops, and targets.
What Is Price Confluence?
Price confluence is a cluster of technical signals that align around a similar price level. It may occur when horizontal support, a rising trendline, a Fibonacci retracement, and a moving average all meet within a narrow range. The more relevant factors that point to the same area, the more attention that zone deserves.
Confluence does not mean price must reverse or break out at that level. Markets can cut through even the cleanest-looking zone, especially around major news, thin liquidity, or a strong trend. Its value is in probability and trade structure. Rather than acting because one line appears on a chart, you wait for several pieces of evidence to support the same idea.
Think of confluence as a location, not a standalone signal. The location tells you where to focus. Price action, volume, momentum, and your chosen timeframe help determine whether a trade is actually worth taking.
Why Price Confluence Matters to Traders
Trading decisions improve when they are based on a defined process rather than a single indicator. Price confluence helps create that process by narrowing a chart full of possible levels into a few areas that matter most.
A well-defined confluence zone can help you identify where buyers may defend a pullback, where sellers may cap a rally, or where a breakout needs confirmation. It also makes risk easier to measure. If price fails clearly beyond the zone, the original trade idea may no longer be valid.
This matters across stocks, forex, crypto, and index markets. The exact tools may change, but markets repeatedly react around visible levels where traders have placed orders, managed positions, or reassessed momentum. Confluence helps organize those levels without pretending that technical analysis is certainty.
What Creates Price Confluence?
Strong confluence usually combines factors that measure different parts of market behavior. Stacking four versions of the same signal can create false confidence. For example, several moving averages clustered together are useful, but they do not carry the same weight as a moving average combined with prior support and a retracement level.
Common sources of confluence include:
- Horizontal support and resistance: Prior swing highs, swing lows, daily highs and lows, and clear consolidation boundaries often attract attention because they are visible to many market participants.
- Trendlines and channels: A trendline can show where a trending market has repeatedly found buyers or sellers. When it meets a horizontal level, the area becomes more meaningful.
- Fibonacci retracements and extensions: Many traders watch the 38.2%, 50%, and 61.8% retracement areas during pullbacks. Their value increases when they align with market structure instead of sitting alone in open space.
- Moving averages: The 20, 50, and 200-period moving averages can act as dynamic support or resistance, particularly on widely followed timeframes.
- Volume and volume profile: High-volume nodes and prior areas of heavy trading can reveal prices where the market has accepted value. Low-volume areas may signal faster movement if price breaks through them.
- Price action signals: A rejection wick, engulfing candle, tight consolidation, or strong close from a key zone can provide the trigger that static levels cannot.
Not every chart needs every tool. A trader focused on clean market structure may use horizontal levels, trend direction, and volume. Another trader may add Fibonacci levels for pullback entries. The goal is not to decorate the chart. It is to find evidence that reinforces a specific trade thesis.
How to Use Price Confluence in a Trade Setup
Start with the higher timeframe. If you trade a 15-minute chart, first identify the daily and four-hour trend, major support and resistance, and the most recent swing structure. A confluence zone on a lower timeframe has more value when it agrees with the broader market context.
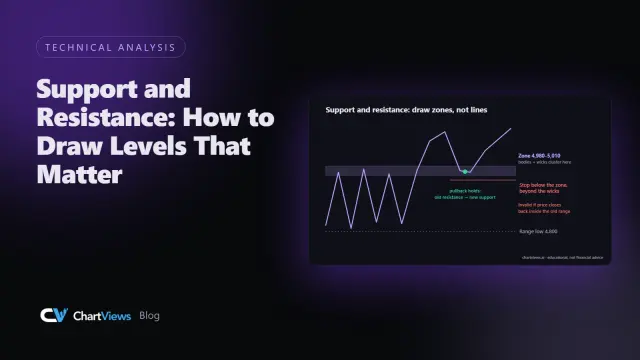
Next, mark the area rather than a single exact price. Markets rarely reverse to the penny. A support zone may span from $98.80 to $99.20, for example, with a prior daily low at $99, a 50-period moving average near $99.10, and a 61.8% retracement at $98.95. That is a zone where you should watch closely, not automatically buy.
Then wait for a trigger. In an uptrend, a trader might look for price to enter the zone, reject lower prices, and reclaim an intraday level with rising volume. In a downtrend, the reverse may apply: price tests resistance, fails to hold above it, and breaks back below a short-term support level.
Your entry should match your trading style. Aggressive traders may enter on the first strong rejection from a confluence zone. Conservative traders may wait for a close back above support, a retest, or a break of a local swing high. Waiting can reduce false starts, but it can also mean entering later with a wider stop or less reward potential.
Define invalidation before you enter. If your long idea depends on a support zone holding, the stop should sit beyond a logical level where that support has failed, not at a random dollar amount. Then identify the next resistance zone or projected move as a potential target. A favorable setup still needs enough potential reward to justify the risk.
A Price Confluence Example
Imagine a stock in a clear daily uptrend that pulls back after making a new high. On the four-hour chart, the pullback reaches a prior breakout level near $150. That same area aligns with the 50-period moving average and the 50% Fibonacci retracement of the latest advance.
At $150, price initially dips below the level but quickly recovers and closes with a strong bullish candle. Volume increases, and the next candle breaks above the short-term consolidation high. The confluence did not create the trade by itself. It identified where a pullback could end, while the recovery candle and structure break provided confirmation.
A logical invalidation point may sit below the low of the rejection and the confluence zone. A potential target could be the prior high, followed by the next measured resistance area. If price breaks below $150 and holds there, the setup is weakened. The disciplined response is to respect the invalidation, not search for another indicator to justify holding.
When Confluence Can Mislead You
More signals do not automatically create a better trade. The first risk is correlation. Three oscillators may all look oversold because they are calculating similar information from the same price move. That is not three independent reasons to buy.
The second risk is ignoring trend strength. A confluence support zone during a sharp bearish breakdown can fail quickly. Countertrend trades demand stronger confirmation because the larger flow of the market is working against them. In fast markets, price may move through a technically valid area before a lower-timeframe signal develops.
The third risk is drawing levels to fit a desired trade. If every minor swing becomes support or resistance, confluence becomes easy to manufacture. Use clearly visible levels, consistent settings, and a repeatable review process. If you cannot explain why each factor belongs on the chart, it probably should not influence the trade.
Build Faster, More Disciplined Chart Reviews
Price confluence is most useful when it becomes part of a consistent checklist: establish trend, mark major structure, identify overlapping levels, wait for confirmation, and define risk. That workflow reduces analysis paralysis because it gives every chart the same decision framework.
For traders reviewing multiple markets, instant AI-powered chart analysis can speed up the first pass by identifying trends, support and resistance, and potential entry and exit zones. ChartViews AI can help organize that information from an uploaded chart, leaving you more time to evaluate context, confirmation, and risk.
The next time a chart looks crowded or uncertain, do not hunt for one perfect indicator. Find the price area where independent evidence aligns, then let market behavior tell you whether that zone deserves your capital.
Want a structured second read of your own chart? Run an analysis on ChartViews AI.
Educational content, not financial advice. Trading involves risk of loss.
 Money Circle Blog

 Trader Reflect Blog