8 Best Tools for Trade Planning for Active Traders
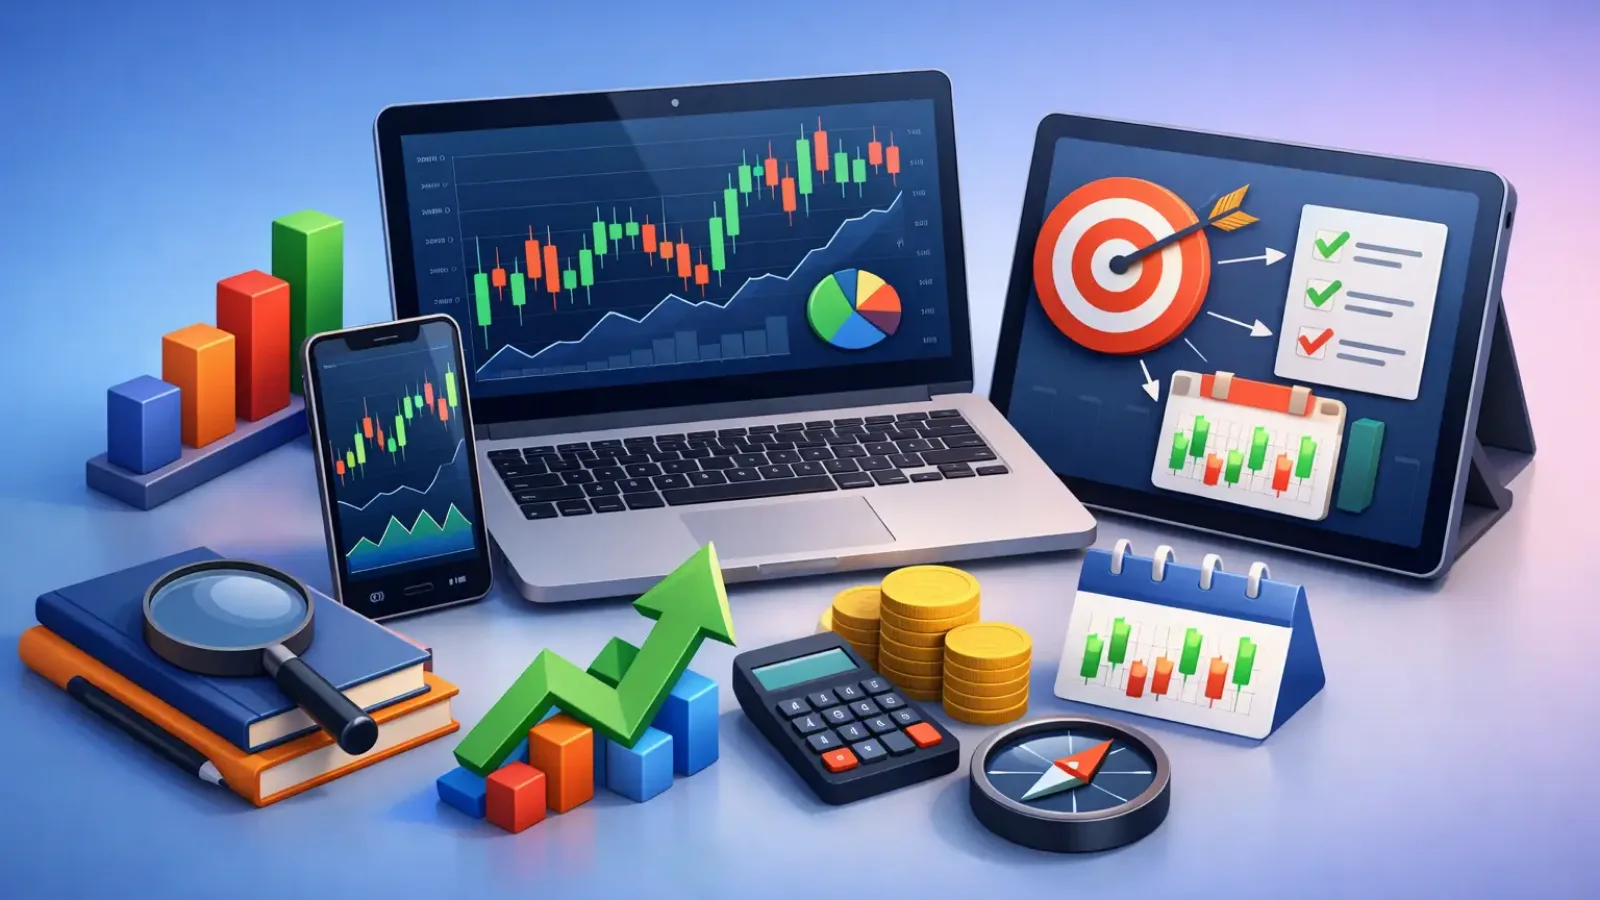
A trade can look perfect on a chart and still fail because the plan was never defined. The entry was vague, the stop was emotional, the target moved after price started moving, and the position size ignored the actual risk. The best tools for trade planning solve that problem before capital is on the line.
For active traders, planning is not extra paperwork. It is the operating system behind consistent execution. The right tool stack should help you identify a valid setup, quantify risk, set price-based decisions, and review whether you followed the plan. It should make the next decision clearer, not add another screen full of noise.
What the Best Tools for Trade Planning Must Do
A useful planning tool does one of two things: it improves the quality of a decision or reduces the time required to make it. If it does neither, it is probably a distraction.
Your trade plan needs a clear market thesis, a trigger for entry, an invalidation point, one or more targets, position size, and a defined response if the market does something unexpected. Different tools support different parts of that process. No single platform will replace judgment, but the right combination can make judgment more repeatable.
The most effective workflow is usually simple: analyze the chart, confirm the trade context, calculate risk, prepare execution, then record the result. Here are the tools that matter most.
1. AI Chart Analysis for Faster Technical Readings
Chart analysis is where many traders lose time. They flip through timeframes, redraw levels, second-guess trend direction, and miss a setup while trying to interpret it. AI-powered chart analysis can speed up the first review by identifying trend structure, potential support and resistance zones, and actionable entry and exit areas from a chart image.
ChartViews AI fits this part of the workflow. Upload a chart and use the analysis as a structured second read before placing a trade. This is especially useful when scanning several stocks, forex pairs, or crypto assets and trying to separate clean setups from charts that need more confirmation.
The trade-off is straightforward: AI analysis is decision support, not a substitute for risk control. A level can be technically relevant and still fail during a high-impact news event or a broad market reversal. Use the output to sharpen your plan, then check the larger market context and your own rules.
2. Multi-Timeframe Charting Platforms
A charting platform remains the core workspace for visual traders. It should let you compare timeframes, mark levels, view volume, set price alerts, and keep your layouts consistent across markets.
The goal is not to add every indicator available. A clean chart with price structure, key moving averages if they are part of your system, volume, and pre-marked levels will often provide more value than a screen crowded with signals. Your chart should answer specific questions: Is the asset trending or ranging? Where is the nearest decision level? Is there room to the target before resistance or support?
Multi-timeframe analysis also prevents a common planning error: entering a short-term setup directly into a major higher-timeframe barrier. A five-minute breakout may be valid, but if it is running into daily resistance, the reward potential may not justify the risk.
3. Market Screeners for Finding Setups Before the Open
A screener turns a broad market into a focused watchlist. Instead of reacting to whatever is moving on social media, you can search for assets that match the conditions your strategy requires.
For stock traders, those conditions might include unusual volume, a gap above a key level, relative strength, a minimum daily range, or a specific price range. Forex traders may screen for volatility around major sessions and economic events. Crypto traders may prioritize volume expansion, trend alignment, or a breakout from a defined range.
A screener does not create an entry signal on its own. It gives you candidates. Every candidate still needs a chart-based plan with a precise invalidation point. That distinction matters because high volume and a strong percentage move can signal opportunity, but they can also signal a move that is already extended.
4. Economic Calendars and News Feeds
Technical levels do not exist in a vacuum. A strong setup can become highly unpredictable when inflation data, an interest-rate decision, earnings, or a major company announcement is minutes away.
An economic calendar helps you plan around scheduled volatility. Before entering, check whether your holding window overlaps with a relevant event. A day trader might avoid opening a new position just before a major release. A swing trader may reduce size or decide whether holding through earnings fits the strategy.
News feeds add context for unscheduled moves. Use them to understand why an asset is moving, not to chase a headline after the move has already expanded. The practical question is always the same: has the news changed your trade thesis, or is price still respecting the level that defined the setup?
5. Position Size and Risk-Reward Calculators
A trade plan is incomplete until the position size is known. Many traders choose size first, then place a stop where the dollar loss feels tolerable. That reverses the process.
Start with the technical invalidation level. Then determine how much account capital you are willing to risk if that level is hit. A position size calculator converts the distance between entry and stop into the appropriate share, contract, lot, or coin size.
For example, if your maximum risk is $100 and the gap between entry and stop is $0.50 per share, the maximum size is 200 shares before accounting for fees and slippage. If the chart requires a wider stop, size gets smaller. That is not a missed opportunity. It is disciplined exposure.
Risk-reward calculators also reveal weak trades early. If the first logical target offers less than the amount at risk, the setup may need a better entry, a different target structure, or no trade at all. The calculator does not predict winners. It ensures a losing trade remains survivable.
6. Trading Journals With Screenshot Support
The market gives feedback, but only traders who record their decisions can use it. A trading journal should capture the setup, entry, stop, target, size, market context, result, and a chart screenshot from before and after the trade.
The screenshot is critical. Numbers alone cannot show whether you entered into resistance, ignored a failed breakout, or exited early despite price following the original plan. Over time, image-based review exposes recurring habits much faster than memory does.
Track execution separately from profit and loss. A losing trade can be well executed if it followed a valid plan and respected risk. A winning trade can be poor execution if it was oversized or entered without a stop. This distinction protects you from learning the wrong lesson from a lucky result.
7. Price Alerts and Order Management Tools
Staring at a chart all day encourages impulsive entries. Price alerts let the market come to your level instead. Set alerts around planned breakout points, pullback zones, support, resistance, and invalidation levels.
When an alert triggers, return to the chart and assess the current structure. Do not assume the original plan still applies. Price may have reached the level after a sharp reversal, a news release, or a change in broader market conditions.
Order management tools matter just as much once you enter. Bracket orders, where available, can place a protective stop and profit target alongside the entry. They reduce the chance that a fast move catches you without protection. For highly liquid markets, these tools can support efficient execution. In volatile or thin markets, remember that stops can fill worse than expected, so your sizing should allow for slippage.
8. A Written Trade Plan Template
The final tool is the least technical and often the most valuable: a repeatable written template. It can live in a notes app, spreadsheet, or journal, as long as you use it before every trade.
Write the ticker or market, directional thesis, timeframe, entry trigger, stop level, target levels, position size, risk amount, scheduled event risk, and the condition that would cancel the trade. Keep it brief enough to complete in under two minutes. If you cannot explain the trade clearly, you are probably not ready to take it.
A template also prevents plan drift. Once the position is open, you can compare market behavior with what you actually intended to do. That makes it easier to manage a trade by rules rather than fear, hope, or the urge to recover a prior loss.
Build a Stack That Matches Your Trading Style
The best setup for a fast intraday trader will not look identical to the best setup for a swing trader. Intraday traders typically need fast chart review, live alerts, event awareness, and reliable order controls. Swing traders may place more emphasis on higher-timeframe chart structure, earnings calendars, wider risk parameters, and journal review.
Start with the weakest part of your process. If you spend too long reading charts, prioritize structured chart analysis. If your losses are inconsistent, prioritize position sizing and predefined stops. If you repeat the same mistakes, make screenshots and journaling non-negotiable.
Every tool should earn its place by helping you plan a trade before emotion takes control. The next time a chart catches your attention, do not ask whether it might move. Ask whether you can define the entry, the risk, and the exit before you commit capital.
Educational content, not financial advice. Trading involves risk of loss.
 Money Circle Blog
 Trader Reflect Blog