How to Avoid Analysis Paralysis in Trading

A clean setup can disappear while you compare three timeframes, redraw the same trendline, and wait for one more indicator to agree. That is the real cost of hesitation. Learning how to avoid analysis paralysis is not about trading faster for its own sake. It is about building a repeatable process that tells you when the evidence is sufficient, when risk is acceptable, and when the best decision is to stand aside.
For active traders, more information is not always an advantage. A watchlist full of symbols, conflicting signals, and nonstop market commentary can turn a simple decision into an exhausting one. The goal is not to analyze every possible outcome. The goal is to make high-quality decisions within the time the market gives you.
Why analysis paralysis damages trading performance
Analysis paralysis happens when the search for certainty delays a decision beyond the point where it is useful. In trading, it can look like missing an entry because you wanted another candle to close, exiting early after finding a bearish opinion online, or skipping a valid setup because the chart is not perfect.
Markets rarely offer perfect alignment. Price can be bullish on a higher timeframe while pulling back on a lower timeframe. Volume can support a breakout while the broader sector remains weak. If your process requires every signal to agree, you will either enter too late or never enter at all.
Hesitation also creates inconsistency. You may take a marginal trade on one day because you are feeling confident, then reject the same setup on another day because you found one reason to doubt it. Over time, that makes it nearly impossible to know whether your strategy actually has an edge.
The answer is not blind conviction. It is defined conviction: enough evidence to act, a known level that proves your idea wrong, and a position size that keeps one loss from becoming a major event.
How to avoid analysis paralysis with a fixed process
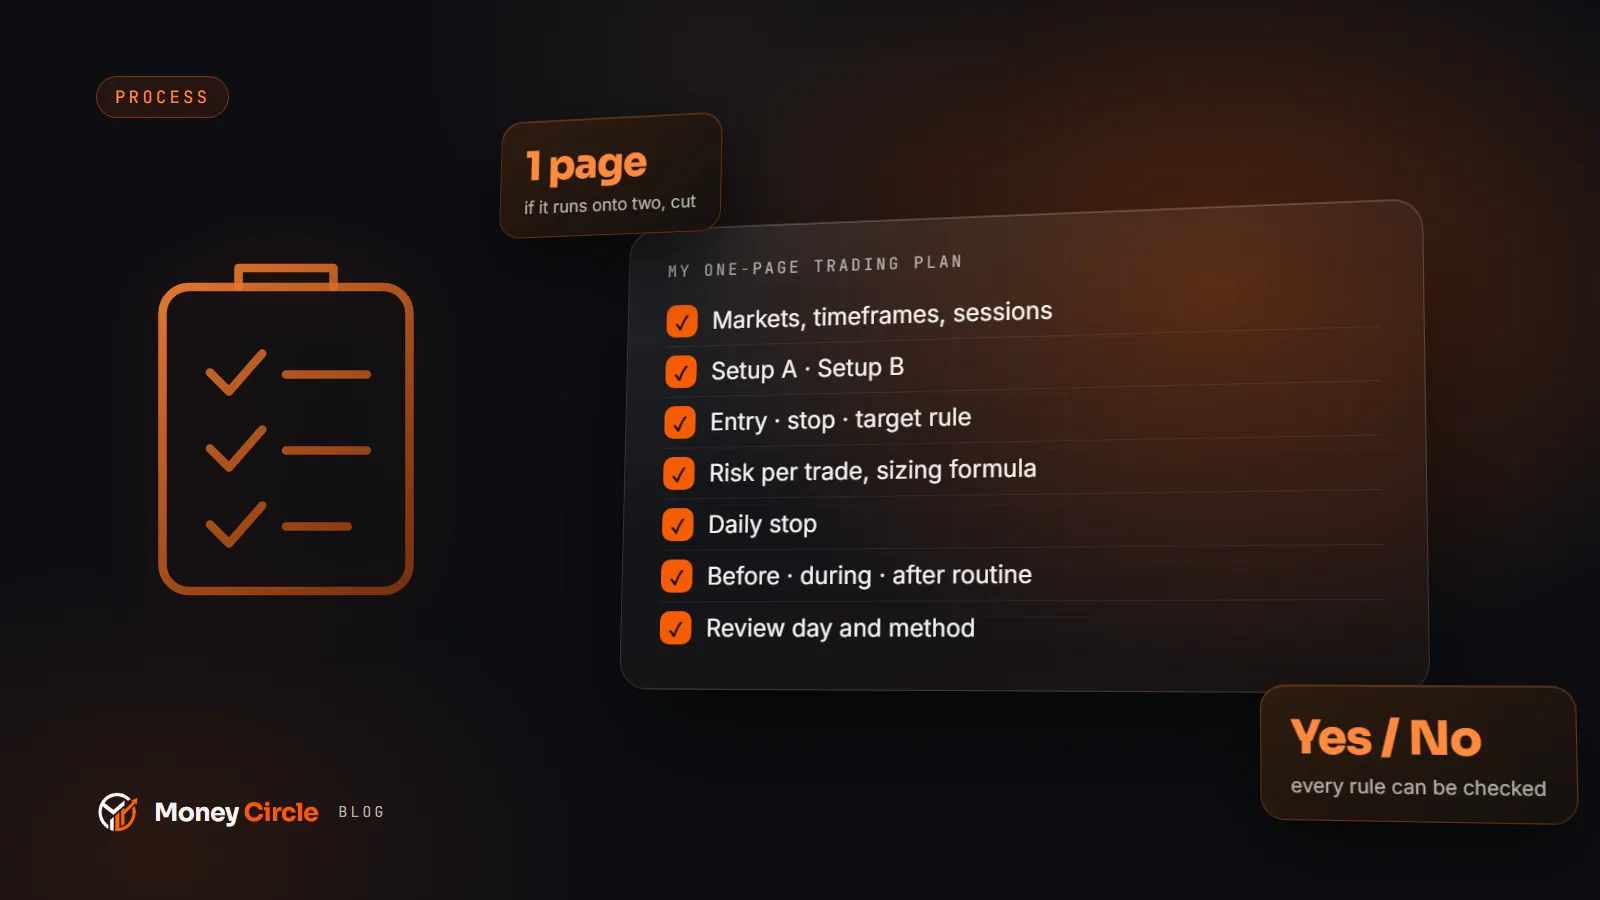
A trading process should reduce choices, not create more of them. Before the market opens or before you begin chart review, decide exactly what qualifies as a setup. This creates a line between analysis and execution.
Start with three questions: What is the market structure? Where is the trade invalidated? Is there enough room to the next meaningful level to justify the risk? If you cannot answer those questions clearly, you do not have a trade yet. If you can, you may not need ten more indicators.
Define your setup in observable terms
Vague rules invite endless interpretation. “Looks strong” and “might break out” are opinions, not criteria. Convert your strategy into conditions you can see on a chart.
For example, a breakout trader might require price to close above a defined resistance level, hold above that level on a retest, and offer a stop below the retest low. A trend-following trader might require higher highs and higher lows, a pullback into support, and confirmation that buyers have regained control. The exact rules depend on your market, timeframe, and style. What matters is that they are specific enough to repeat.
Your setup does not need six confirmations. It needs the confirmations that have proven useful in your own review. Adding rules after every losing trade usually makes a system more complicated without making it better.
Separate analysis time from execution time
There is a major difference between preparing a plan and debating a live trade. Do the deeper work before price reaches your level. Mark support and resistance, note trend direction, identify invalidation, and decide what would trigger an entry.
When the level is reached, execution should be comparatively simple. Either price meets your criteria or it does not. If you find yourself doing fresh, detailed research after the trigger appears, your preparation was incomplete.
This does not mean every trade must be automatic. Fast-moving markets can change character quickly, and scheduled news can invalidate a technical setup. But a prepared trader adjusts to new information. An unprepared trader keeps searching for permission.
Use a decision deadline
A decision deadline prevents a valid opportunity from becoming an emotional standoff. For a day trade, the deadline may be the close of the trigger candle or the loss of a key intraday level. For a swing trade, it may be the end of the session or a defined number of days after a breakout.
The deadline should match your timeframe. A five-minute setup cannot wait for daily-chart certainty. A multi-week position should not be abandoned because of one noisy intraday candle. Align the speed of your decision with the speed of your trade.
Reduce chart noise before it reduces your confidence
Many traders confuse a crowded chart with a thorough analysis. Multiple moving averages, oscillators, volume tools, Fibonacci levels, and social sentiment may all provide context, but they can also produce contradictory signals.
Choose a small core set of inputs that serves a clear purpose. Price structure tells you direction and context. Support and resistance show where decisions may occur. Volume can help assess participation. Beyond that, every tool should earn its place by improving a decision you actually make.
A useful test is simple: if removing an indicator would not change your entry, stop, target, or position size, it may be adding visual noise rather than edge.
This is where structured chart review saves time. Instead of manually reinterpreting every line on every chart, traders can use instant AI-powered analysis to identify trend direction, key support and resistance zones, and potential entry and exit areas. ChartViews AI can help turn an uploaded chart into an organized starting point, so your attention stays on trade quality and risk rather than repetitive chart scanning.
AI analysis is not a substitute for judgment. It is a faster way to surface the technical structure that should inform that judgment. You still need to account for your strategy, market conditions, upcoming catalysts, and risk tolerance.
Make risk rules do the hard work
The strongest cure for analysis paralysis is often not a better entry signal. It is confidence that your downside is controlled.
Before entering, define the price level that invalidates the trade. This should be a technical level, not an arbitrary dollar amount you hope the market will respect. Then calculate position size based on the distance between your entry and stop. When risk is predetermined, the question changes from “What if I am wrong?” to “Is this a loss I have already decided I can afford?”
Set a minimum reward-to-risk threshold, but use it intelligently. A 2:1 target may look attractive on paper, yet be unrealistic if major resistance sits directly overhead. Conversely, a trend trade may justify holding beyond an initial target if the structure remains strong. The point is to evaluate the path of price, not just the ratio on a calculator.
You also need a rule for no-trade conditions. Avoid entering when price is trapped in the middle of a range, when the stop required is too wide for your risk limit, or when a major scheduled event could make normal technical levels unreliable. Passing on a weak setup is decisive trading too.
Stop reopening decisions after you enter
Analysis paralysis does not end at the buy or sell button. It often continues as traders constantly adjust stops, second-guess targets, and react to every small candle.
Create management rules before entering. Know whether you will take partial profits at a predefined level, trail a stop under higher lows, or exit if price closes back below a breakout level. Then follow those rules unless genuinely new information changes the trade thesis.
This is a critical distinction. New information might be a sharp market-wide reversal, unexpected news, or a technical breakdown at your stated invalidation point. A normal pullback, one red candle, or an anxious feeling is not new information.
If you repeatedly interfere with trades, review your position size. A position that feels impossible to hold is often too large. Reducing size can give your strategy enough room to work and make disciplined execution more realistic.
Review decisions, not just profits and losses
A profitable trade can be poorly executed, and a losing trade can be a perfect execution of a sound plan. If you only judge yourself by the result, you will reinforce luck and abandon discipline.
After each session, record whether the setup met your criteria, whether the entry followed your trigger, whether risk was defined, and whether you managed the position according to plan. Keep the review short and factual. The goal is to identify recurring errors, not to write a story that explains every market move.
Over several trades, patterns become visible. You may find that your best results come from first pullbacks in strong trends, that you enter too late after extended moves, or that your most expensive losses happen when you trade before major news. Those observations are more valuable than another hour spent searching for a flawless indicator.
Build confidence through repetition
Confidence is not the belief that every trade will work. It is the belief that you can recognize your setup, control the risk, and execute the next decision without needing certainty.
Keep your chart review focused. Let price structure and key levels carry the analysis. Define the trigger, invalidation, and target before the moment of action. Then give yourself a clear yes, no, or wait decision.
The market will always offer more data than you can process. Your edge comes from knowing which information earns your attention and acting when your plan says the opportunity is there.
Want a structured second read of your own chart? Run an analysis on ChartViews AI.
Educational content, not financial advice. Trading involves risk of loss.
 Money Circle Blog
 Trader Reflect Blog