What Is the Best Indicator for Trend Reversal?

Most traders ask what is the best indicator for trend reversal right after getting trapped at the top of a move or shorting a market that keeps grinding higher. That question makes sense, but it hides a bigger issue. Reversals are rarely confirmed by one indicator alone. The traders who catch them consistently usually rely on confluence, not a magic signal.
If you want the short answer, the best indicator for trend reversal is usually price action confirmed by momentum divergence and key support or resistance. That is not a flashy answer, but it is the one that holds up across stocks, forex, crypto, and indices. A reversal matters only when the market starts rejecting the prior trend in a visible way, and price is always the final proof.
What is the best indicator for trend reversal in real trading?
There is no single indicator that works best in every market condition. RSI, MACD, moving averages, volume, Bollinger Bands, and stochastic oscillators can all help. None of them can reliably call reversals on their own.
That is why experienced traders usually put price structure first. If an uptrend is making higher highs and higher lows, it is still an uptrend, even if RSI flashes overbought for three sessions in a row. If a downtrend keeps pressing lower, a bullish crossover means very little unless price also starts reclaiming important levels.
The most useful way to think about reversal signals is this: indicators do not create reversals. They reveal stress in the current trend. Price confirms whether that stress turns into a real shift.
Why price action is usually the strongest reversal signal
Price action leads. Indicators lag because they are built from past price data. That does not make them useless, but it does mean they should support your read, not replace it.
A strong reversal often starts with a loss of trend structure. In an uptrend, that may look like a failed breakout, a lower high, or a breakdown below the last higher low. In a downtrend, it may show up as a failed push lower, a higher low, or a reclaim of resistance that had been holding price down.
Candlestick patterns can help here, but only in context. A hammer at major support after an extended selloff carries more weight than a hammer in the middle of a random range. The same goes for bearish engulfing candles near resistance after a stretched rally. The location matters as much as the pattern itself.
The indicators that actually help spot reversals
If the goal is practical trading, a few indicators stand out because they measure different parts of the same story.
RSI and momentum divergence
RSI is one of the most common reversal tools for a reason. It can highlight when momentum is no longer matching price. If price makes a new high but RSI makes a lower high, that bearish divergence can signal fading trend strength. The opposite applies in downtrends, where bullish divergence can warn that sellers are losing control.
But divergence is an early warning, not an entry signal by itself. Markets can stay overbought or oversold much longer than traders expect. RSI is best used to ask, "Is this trend weakening?" not "Should I enter right now?"
MACD for momentum shift
MACD is useful when you want to see whether trend momentum is actually turning. A bullish or bearish crossover can help confirm a change, especially when it happens after divergence or near a major level. The trade-off is speed. MACD often confirms after the move has already started.
That delay is not always bad. Many traders lose money by entering too early. A slightly later confirmation can filter out weak reversal attempts.
Moving averages for structure change
Moving averages are not ideal for calling tops and bottoms, but they are useful for confirming that a trend may be changing. If price reclaims a short-term moving average, then holds it, then pushes through a longer-term average, that can support the reversal case.
Again, this works better as confirmation than prediction. Moving averages help answer whether the market is actually transitioning, not whether it might.
Volume for conviction
Volume matters most in stocks and some futures markets, and less directly in spot forex. When a reversal happens with strong volume, it carries more credibility. A breakout above resistance on rising volume, or a flush into support followed by heavy buying, tells you participation is behind the move.
Low-volume reversals are more fragile. They can work, but they fail more often because conviction is missing.
What is the best indicator for trend reversal if you want one setup?
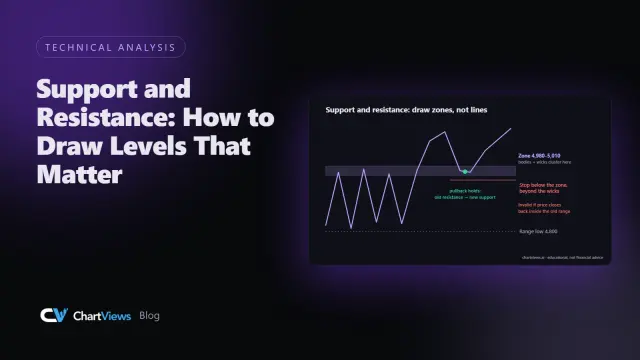
If you insist on narrowing it down to one repeatable setup, the highest-quality answer is this: momentum divergence at a major support or resistance level, confirmed by price breaking structure.
That setup works because it combines three important conditions. First, the market is extended enough for momentum to weaken. Second, price is reacting at a level where traders are likely to make decisions. Third, the structure break gives you actual confirmation instead of a guess.
For example, imagine a chart in a strong uptrend. Price pushes into a prior weekly resistance zone. RSI prints bearish divergence. Then the market fails to make a clean breakout, rolls over, and breaks the most recent higher low. That sequence is far more useful than simply seeing RSI above 70 and calling a top.
The same logic applies in reverse during downtrends. A market sells off into major support, momentum stops confirming the new low, buyers step in, and price reclaims the latest lower high. That is a materially stronger reversal signal than an oversold reading alone.
Where traders get this wrong
The biggest mistake is treating indicators like prediction machines. They are not. An overbought RSI does not mean price must drop. A MACD crossover does not guarantee a trend change. A moving average break does not mean the old trend is dead.
Another mistake is ignoring timeframe context. A reversal on the 5-minute chart may be nothing more than a pullback on the 4-hour chart. Traders who do not align their setup with a higher timeframe often think they found a reversal when they really found noise.
There is also the issue of market regime. In trend-heavy environments, reversal signals fail more often because strong trends tend to stay strong. In range-bound markets, reversal tools can work better because price naturally rotates between support and resistance. The same indicator behaves differently depending on conditions.
A better way to confirm reversals
A disciplined reversal process is usually more reliable than any single tool. Start with the higher timeframe and mark the obvious support and resistance zones. Then look for signs that the current trend is weakening, such as divergence, failed breakouts, or shrinking momentum. After that, wait for a structure break on your execution timeframe.
This is where speed matters. Reviewing multiple charts manually can lead to hesitation or inconsistency, especially if you trade more than one market. A structured workflow helps you spot the same sequence every time instead of making a different judgment on every chart. That is one reason traders use AI-assisted chart analysis tools like ChartViews AI - not to replace decision-making, but to identify trend conditions, key levels, and possible reversal zones faster.
The best reversal indicator depends on your style
Scalpers, swing traders, and position traders do not need the same confirmation. A scalper may care more about momentum shifts and intraday levels. A swing trader may give more weight to daily support and resistance with RSI divergence. A position trader may focus on weekly structure and moving average trend changes.
This is why the right question is not only what is the best indicator for trend reversal. It is also best for what timeframe, what market, and what type of trade. If you are trading crypto during high volatility, you may need more confirmation because false reversals are common. If you are trading a large-cap stock near earnings, technical signals may be overridden by news.
The best traders stay flexible. They use a framework, not a fixed belief.
The bottom line traders can actually use
If you want a practical answer, trust price action first, then use RSI or MACD to confirm momentum loss, and always pay attention to major support and resistance. That combination gives you a better shot at identifying real reversals instead of reacting to every temporary pause.
The market does not reward traders for finding the cleverest indicator. It rewards traders who wait for evidence, respect context, and act when the setup is clear. The next time a chart looks ready to turn, do not ask whether one line on one indicator says yes. Ask whether price, momentum, and structure are all starting to say the same thing.
Educational content, not financial advice. Trading involves risk of loss.

 Money Circle Blog
 Trader Reflect Blog