What Is Trading Analysis and Why It Matters
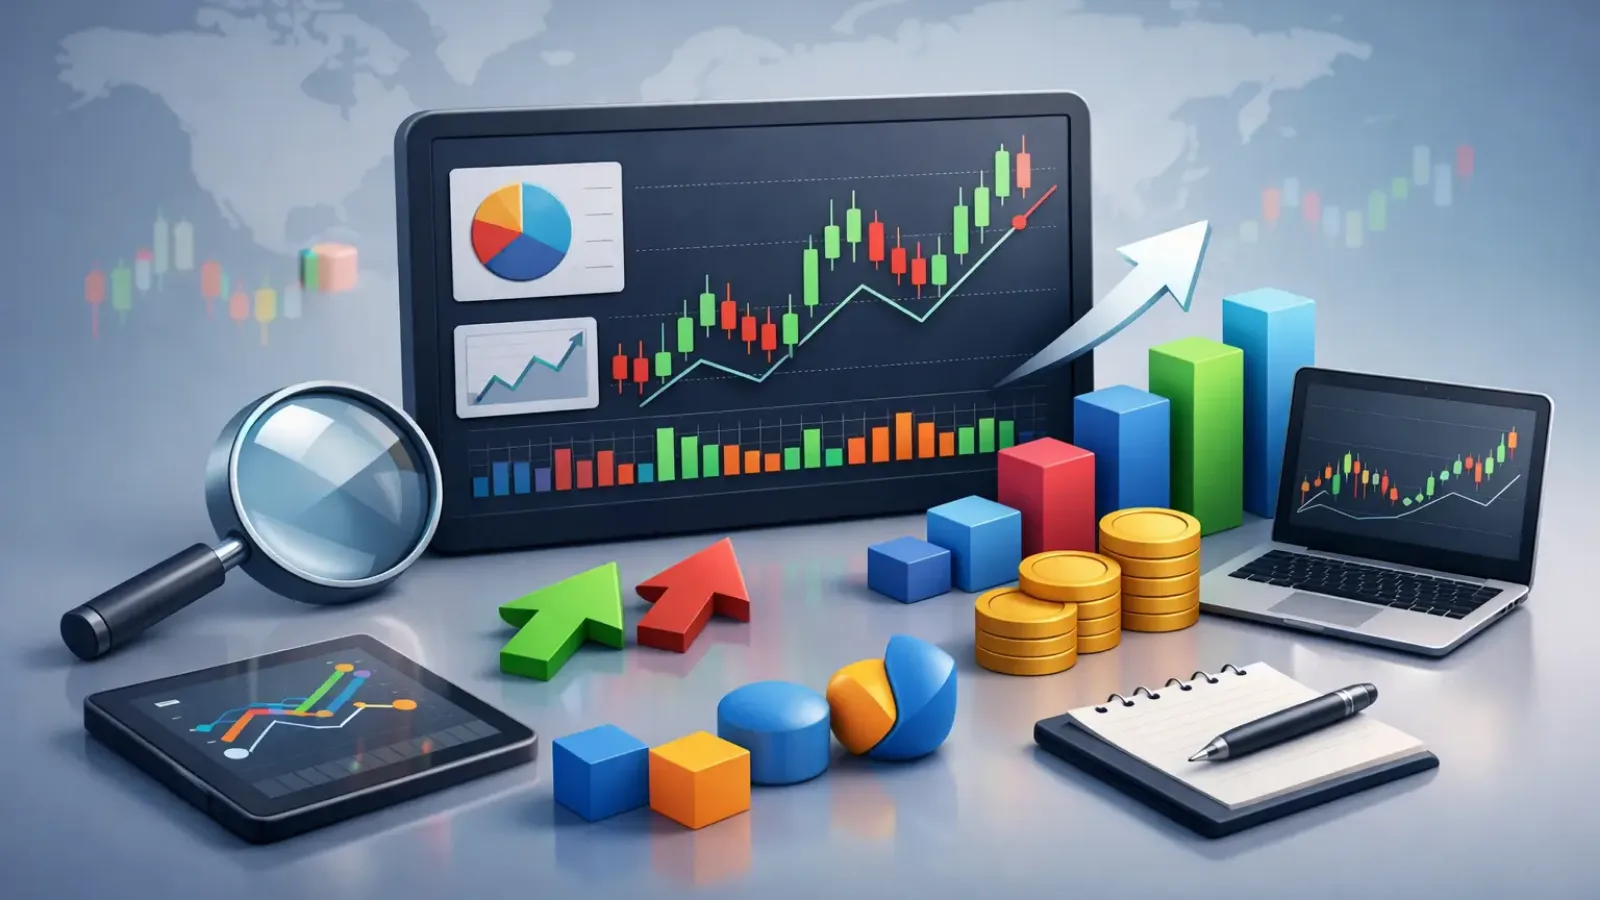
A chart can look obvious after the move happens. Before it happens, it rarely feels that clean. Price is moving, news is noisy, and every setup seems to have a reason to work and a reason to fail. That is where what is trading analysis becomes a practical question, not just a basic one. If you trade stocks, forex, or crypto, trading analysis is the process of reading market information so you can make better decisions on entries, exits, risk, and timing.
At its core, trading analysis helps answer four questions. What direction is the market leaning? Where are the key levels? What would confirm the trade? And where does the idea break down? Without that structure, traders tend to chase momentum late, exit too early, or hold weak positions longer than they should.
What Is Trading Analysis?
Trading analysis is the method traders use to evaluate a market before placing a trade. It combines price action, chart structure, market context, and sometimes external data to estimate probability. The goal is not certainty. The goal is to make a decision with a clear reason behind it.
That distinction matters. New traders often assume analysis should predict exactly what happens next. Experienced traders know it is more about scenario planning. A strong analysis process identifies the most likely path, the invalidation point, and the risk if the idea fails.
In practice, trading analysis can be simple or advanced. One trader may look at trend direction and support and resistance. Another may add indicators, volume, volatility, higher time frame context, and macro factors. Neither approach is automatically better. The best process is the one that improves consistency without slowing you down so much that you miss the trade.
The Two Main Types of Trading Analysis
Most traders work with two broad categories: technical analysis and fundamental analysis. Some rely heavily on one. Others combine both.
Technical analysis
Technical analysis focuses on the chart. Traders study price movement, trend structure, support and resistance, candlestick behavior, momentum, and volume to evaluate whether a setup has an edge. This is the most common form of trading analysis for short-term traders because it is fast, visual, and directly tied to execution.
If a market is trending higher, repeatedly holding a support zone, and breaking recent highs with momentum, that tells you something actionable. You may not know why every buyer is buying, but the chart is showing demand.
Technical analysis is especially useful when timing matters. It helps traders define entries, stop-loss placement, and profit targets with more precision. The trade-off is that chart signals can be interpreted differently by different people, which is why structure and discipline matter so much.
Fundamental analysis
Fundamental analysis looks at the forces behind price. In stocks, that can include earnings, revenue growth, margins, valuation, and sector conditions. In forex, traders watch interest rates, inflation, central bank policy, and economic data. In crypto, they may track adoption trends, token mechanics, regulation, and sentiment.
This style of analysis answers a different question. Instead of asking, “Where is price likely to react next?” it asks, “What should this asset be worth, or what larger force is driving it?” That can be useful for swing traders and position traders who hold longer and want stronger context.
The downside is timing. A market can stay disconnected from fundamentals longer than many traders expect. A strong company can still sell off. A weak one can still rally. That is why many active traders use fundamentals for context and technicals for execution.
Why Trading Analysis Matters More Than Trade Ideas
Most losing trades do not come from a lack of ideas. They come from poor filtering. There is always another breakout, another pullback, another headline, another coin moving 8% in an hour. Analysis is what separates random activity from a repeatable process.
Good trading analysis reduces impulsive decisions. It forces you to define why you are taking the trade, what you expect to happen, and what evidence would prove you wrong. That alone can improve discipline.
It also helps with speed. That may sound backward, but structured analysis usually makes traders faster, not slower. When you know exactly what you are checking for - trend, levels, momentum, invalidation - you spend less time guessing and more time acting on qualified setups.
For active traders, that efficiency matters. Reviewing multiple charts manually can be slow, especially when market conditions are changing quickly. A more structured workflow makes it easier to compare setups, spot stronger opportunities, and avoid overtrading lower-quality ones.
What Traders Actually Look For
When traders analyze a chart, they are usually not searching for a perfect pattern. They are looking for alignment.
Trend is the first layer. Is the market making higher highs and higher lows, or is it drifting lower? A trade that follows the dominant trend often has better odds than one fighting it.
Then come the levels. Support and resistance show where buyers or sellers have previously reacted. These areas matter because they often become decision zones. Price may reject, break through, or retest them.
Momentum adds another layer. A breakout with strong participation and clean candles is different from a breakout that barely clears resistance and stalls immediately. The same goes for pullbacks. Some are healthy pauses in trend. Others are early signs that the move is losing strength.
Volume, volatility, and time frame context also matter. A setup can look strong on a five-minute chart and weak on a four-hour chart. That does not mean one view is wrong. It means analysis has to match your trading horizon.
What Is Trading Analysis for Beginners?
For beginners, what is trading analysis really comes down to one thing: building a repeatable way to read a chart without relying on guesswork. You do not need ten indicators. You need a clear process.
Start with trend. Mark support and resistance. Identify whether price is consolidating, breaking out, or pulling back. Then decide what would make the setup valid and where it would fail. That gives you a framework for the trade before money is involved.
The biggest mistake beginners make is treating analysis like prediction. They want certainty before entering. Markets do not offer that. A better goal is controlled decision-making. If your setup meets your criteria, you take the trade. If it does not, you wait.
This is also where many traders hit analysis paralysis. Too many indicators, too many opinions, and too much chart time can make execution worse. Simpler analysis, done consistently, usually beats a complicated method that changes every week.
Where AI Fits Into Modern Trading Analysis
AI is changing how traders handle chart review, especially when speed and consistency matter. Instead of staring at every setup from scratch, traders can use AI-powered tools to identify trend direction, key support and resistance levels, and possible entry and exit zones in seconds.
That does not replace judgment. It improves workflow. If you are scanning multiple markets, AI can reduce the time spent on manual chart reading and help standardize your process. That is valuable for beginners who want structure and for experienced traders who want faster confirmation.
The key is to treat AI as decision support, not blind automation. The best use case is disciplined assistance. You still need to check market context, align the setup with your plan, and manage risk. But when a tool can quickly surface technical structure from a chart, it removes friction from the analysis phase.
That is why platforms like ChartViews AI are useful for active traders. The advantage is not just speed. It is structured, repeatable chart interpretation that helps reduce hesitation and improve execution quality.
The Limits of Trading Analysis
Trading analysis improves probability. It does not remove uncertainty. A perfect-looking setup can fail on unexpected news. A weak chart can rally anyway. Liquidity, sentiment, and broader market conditions can shift fast.
That is why analysis and risk management have to work together. Even strong analysis needs position sizing, stop placement, and realistic expectations. If your process is good but your risk control is poor, the results can still be bad.
It also depends on the market and time frame. Technical analysis tends to be especially useful in liquid, chart-driven markets and shorter-term trading. Fundamentals may matter more over longer holding periods. Neither is universally superior. The right mix depends on how you trade.
A serious trader does not ask whether analysis can be wrong. Of course it can. The better question is whether your analysis helps you make clearer, faster, and more disciplined decisions over a large sample of trades.
That is the real value. Trading analysis gives shape to uncertainty. It helps you stop reacting to every move and start evaluating the market with intent. When your process gets sharper, your decisions usually do too - and that is where progress starts.
Educational content, not financial advice. Trading involves risk of loss.
 Money Circle Blog
 Trader Reflect Blog