How to Draw Trend Lines That Hold, Step by Step
In this article
Almost every chart on the internet has a trend line drawn on it, and most of them mean very little. A line connected through two convenient points, extended to the edge of the screen, will always look convincing afterwards. What matters is whether you can draw the line before the next candle, with rules that another trader could repeat, and whether it holds often enough to be worth planning around.
This guide shows how to draw a trend line on a gold (XAU/USD) chart, how to tell a line that deserves attention from one that does not, what a break actually means, and how to turn a touch of the line into a plan with a stop and a target. All prices are hypothetical round numbers chosen to make the example easy to follow. Nothing here says where gold will trade next, and it is educational, not advice.
What a trend line is, and what it is not
A trend line connects a series of swing lows in an uptrend (or swing highs in a downtrend). It marks the area where buyers have stepped in again and again, or where sellers have. It describes the past slope of price. It does not force price to respect it.
Think of it as a hypothesis: "while price stays above this slope, the uptrend is intact." Like any hypothesis it can be wrong, and the useful question is where you would admit that. We cover the same idea for horizontal levels in our guide to trade invalidation.
Step 1: pick the timeframe first
Trend lines are only meaningful on a timeframe that matches your plan. A line on a five-minute chart can be broken by one news candle and tells a swing trader nothing. Start on the daily or four-hour chart, find the line there, and only then zoom in to plan an entry. If you are unsure which charts to pair, read our guide to multi timeframe analysis.
Step 2: find two clear swing lows
Look for the most recent obvious swing lows: points where price turned up and the candles on both sides are higher. Use the lows of the candles, or the lows of the bodies if wicks are messy, but pick one method and keep it. Mixing them is a common way to make a line fit.
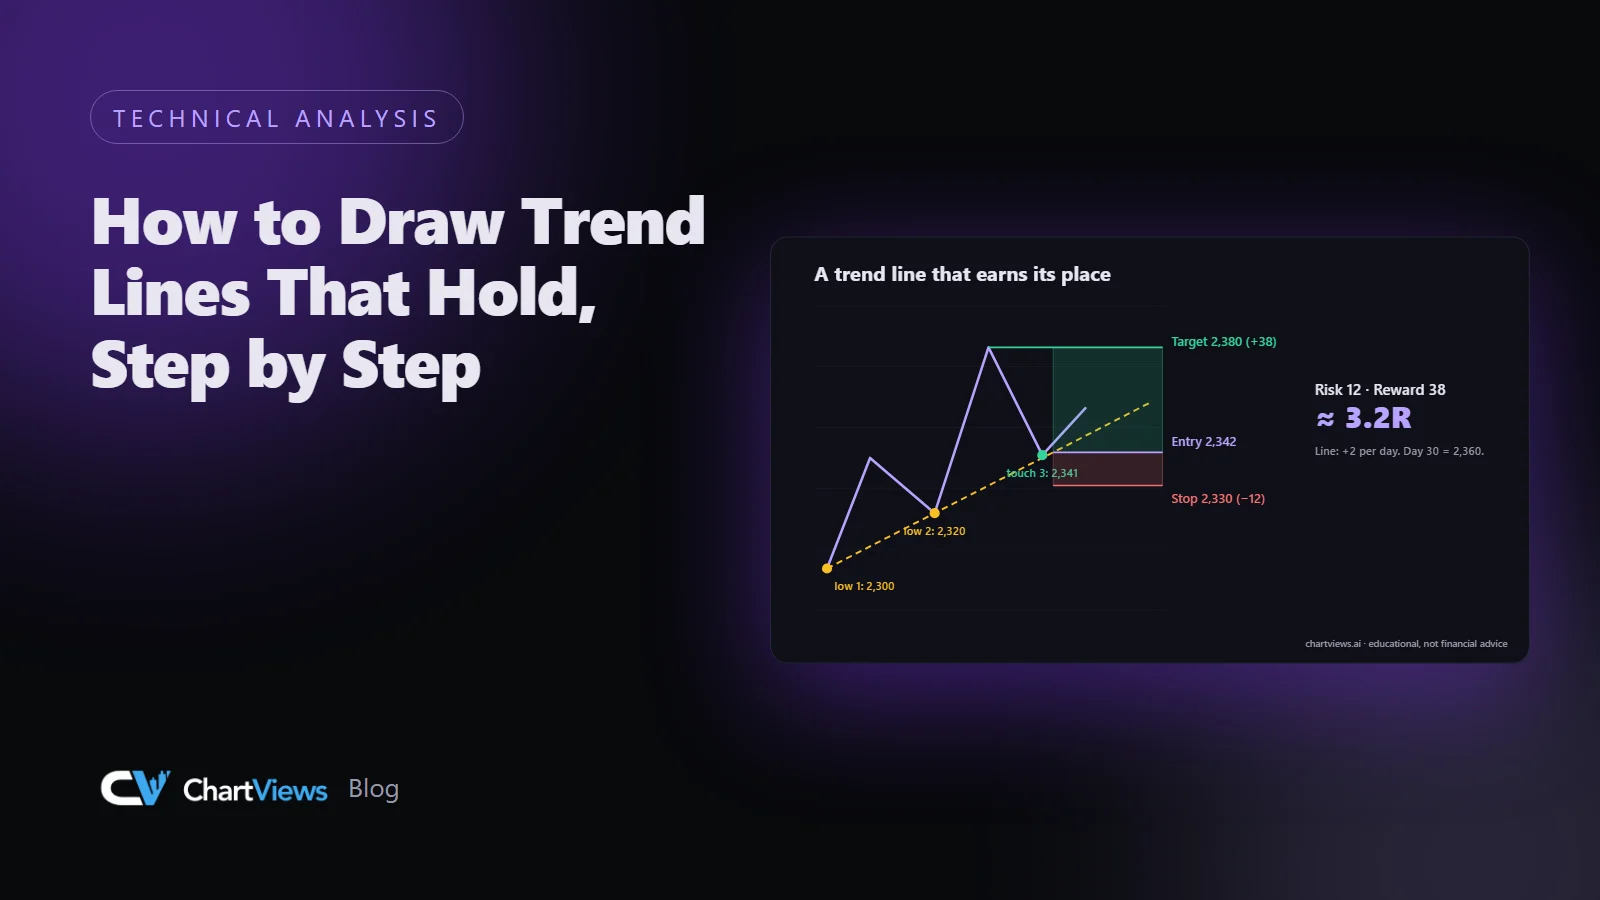
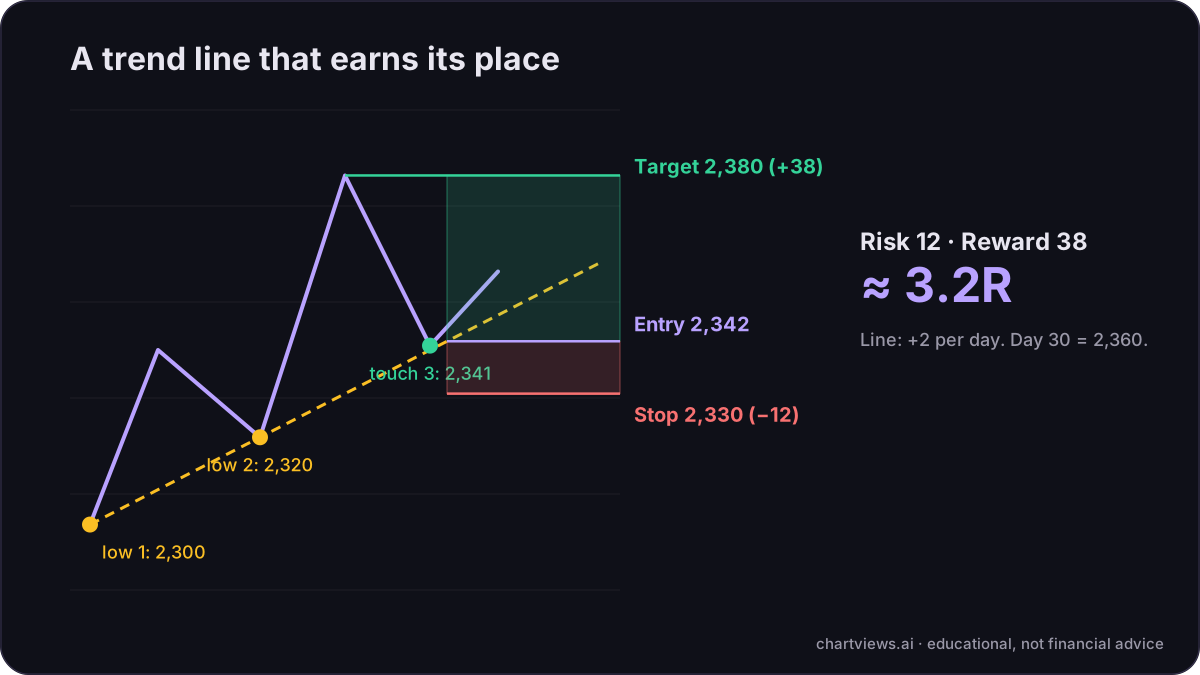
Suppose, hypothetically, that gold made a swing low at 2,300 on day 0 and another at 2,320 on day 10, with a higher low in between that did not stand out. Draw a line through the two points. Its slope is 2 price units per day, so the line sits at 2,340 on day 20 and at 2,360 on day 30.
Two points define any line, so at this stage it is only a candidate. It earns attention when price comes back to it.
Step 3: wait for the third touch
A third touch is the usual test. If price returns to the line on day 20 and turns up from about 2,341, the line has now been respected three times, and the market has told you more than your two original points did. Traders often treat a three-touch line as more reliable than a two-touch line. It is still not a guarantee, but it is a better-founded line.
Be strict about what counts as a touch. A touch means price came within a small distance of the line and turned. A candle that sliced through the line and closed far below it is not a touch. Decide the tolerance before you look. For gold on the daily chart you might allow a few price units either way, and you should write the number down.
Step 4: check the steepness
Steep lines break more easily than gentle ones. A line that climbs faster than the market can sustain is often broken, not because the trend is over but because price needs to rest. If your line is very steep, consider redrawing it on a higher timeframe, where the slope is more moderate, or treat it as a short-term line only.
A line that is almost flat is really a horizontal level, and should be treated that way. Our guide to support and resistance levels that matter shows how.
Step 5: judge a break by the close, not the wick
A wick through the line is common and often meaningless. What matters more is where candles close. A simple rule: the line is broken when a candle on your analysis timeframe closes beyond it, and it is confirmed when the next candle does not close back above it.
In the example, the line would stand at 2,360 on day 30. If gold closes the day at 2,345, that is a close below the line. Is the trend over? Not necessarily. It tells you the slope no longer describes the market, and that structure should be reread from scratch. Often the old line becomes resistance, which you can test as a level.
False breaks happen here too. Our explainer on what causes false breakouts goes through why.
Step 6: turn the touch into a plan
A line is worth drawing because it gives you a place to plan from. Using the hypothetical third touch:
- Entry: 2,342, after a candle has turned up from the line.
- Stop: 2,330, below the line with a buffer for noise. If price closes below the line by that margin, the idea is wrong.
- Target: 2,380, the prior swing high.
The risk is 12 and the reward is 38, about 3.2R. That is only worth anything if the setup is realistic, and the numbers here are invented. The way to use them is in the order shown: the chart gives you the line, the line gives you the stop, and then the size follows. Our position size calculator turns the stop distance into a position, and our guide to position sizing explains the arithmetic.
Common mistakes
- Forcing the line. If you have to ignore a candle to make the line fit, it does not fit.
- Too many lines. Three competing trend lines on one chart mean you have not decided what the trend is.
- Using only the first touch. A line from two points that price has not yet returned to is a guess.
- Ignoring the slope. Very steep lines are fragile, and almost flat ones are levels.
- Redrawing after the fact. If you adjust the line every time price moves, it will always look right and will never be useful. Save the original with a screenshot.
- Setting the stop on the line. Price often touches the line before turning. A stop exactly on it is hit by ordinary noise.
A short checklist
Before you plan a trade from a trend line, answer in writing:
- Which timeframe is this line on, and does it match my plan?
- Which two points define it, and how did I choose them?
- How many times has price respected it, within my stated tolerance?
- How steep is it compared with earlier moves?
- Where would a close beyond the line tell me the idea is wrong?
- What are the stop, the target and the ratio?
If any answer is vague, the line is not ready to trade from.
Using a second read
If you want to compare your own marks with a structured view, upload a gold chart to ChartViews AI. The analysis describes the trend, the main support and resistance areas and some possible scenarios, which you can set beside the line you drew. It does not know what will happen next, and the decision, the stop and the size stay with you. You can see what the report includes on the features page, and our guide to how to read an AI chart analysis report explains each section.
Want a structured second read of your own gold chart? Run an analysis on ChartViews AI.
Educational content, not financial advice. Trading involves risk of loss.
 Money Circle Blog
 Trader Reflect Blog