How to Spot Market Trends Early

Most traders do not miss trends because the market hid them. They miss them because the signal showed up gradually, across price, volume, and structure, while they were waiting for perfect confirmation. If you want to learn how to spot market trends with more consistency, the goal is not prediction. It is reading what the market is already revealing before the move feels obvious.
That shift matters. By the time a trend is clear to everyone, much of the clean opportunity is gone. Entries get worse, stops get wider, and emotion gets louder. Strong traders train themselves to identify trend conditions early enough to act with a plan, not chase with hope.
How to spot market trends without overcomplicating it
A trend is not just price moving up or down. It is a repeated pattern of behavior. In an uptrend, buyers keep defending pullbacks and pushing price to higher highs. In a downtrend, sellers keep capping rallies and driving price to lower lows. Sideways markets do neither with consistency.
That sounds simple, but traders often get stuck because they focus on indicators before they understand structure. Start with the chart itself. Ask whether price is advancing cleanly, rejecting key levels, and respecting a directional path over time. If the answer is mixed, the market may be ranging, and forcing a trend bias usually leads to poor trades.
The fastest way to improve here is to stop looking for a single magic signal. Trends are usually confirmed by alignment, not one clue. Price structure, volume behavior, support and resistance, and momentum all matter. When several of them point in the same direction, you have something usable.
Start with market structure first
If you only check one thing, check highs and lows. Market structure is the foundation of trend recognition because it shows who is in control.
In an uptrend, price tends to print higher lows before it breaks to new highs. That tells you buyers are stepping in earlier on pullbacks. In a downtrend, lower highs often appear before the next leg down. That tells you sellers are staying aggressive and preventing recovery.
This is where many traders make avoidable mistakes. They see one large green candle and call it a new trend. Or they see one hard selloff and assume a reversal has started. One impulse move can be noise. A trend becomes more credible when follow-through confirms it.
A useful question is whether the latest pullback changed the structure or simply tested it. If price retraces but holds above a prior higher low, the uptrend may still be healthy. If it breaks below that level with conviction, market conditions may be shifting. The same logic applies in reverse for downtrends.
Support and resistance reveal trend quality
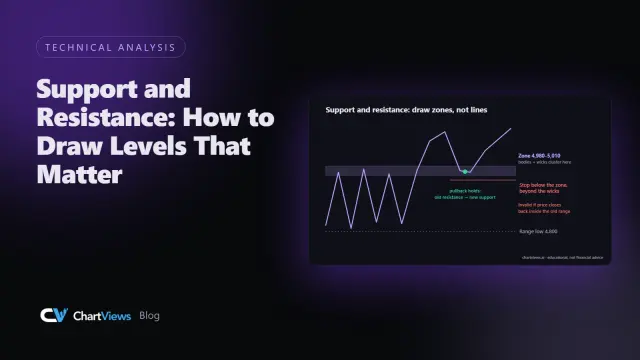
Support and resistance are not just levels to draw on a chart. They are decision zones. They show where traders previously defended price, took profits, or reversed bias. When trends are real, these zones tend to behave in recognizable ways.
In a strong uptrend, old resistance often turns into support. Price breaks above a level, pulls back, holds, and continues. In a weak uptrend, that same breakout may fail quickly and fall back into the prior range. That difference tells you a lot about conviction.
The same is true in a downtrend. If price loses support, retests it from below, and gets rejected, sellers are still in control. If the breakdown cannot hold and price reclaims the level, the trend may be losing strength.
This is one reason trend spotting is easier when you focus on reactions, not just levels. Any trader can mark support or resistance. The edge comes from reading what price does when it gets there.
Volume helps separate real moves from weak ones
Price tells you what happened. Volume helps tell you how much participation was behind it. You should not treat volume as a perfect truth signal, but it adds important context.
When price breaks out with strong volume, the move usually deserves more respect than a breakout on low participation. In many markets, rising volume during directional moves and lighter volume during pullbacks can support the case for trend continuation. If price pushes higher while volume fades sharply, momentum may be less durable than it appears.
There are limits here. Volume behaves differently across stocks, forex, and crypto. Some markets offer cleaner volume data than others. So the trade-off is simple: use volume as confirmation, not as a stand-alone reason to enter.
Use multiple timeframes, but do not fight them
Many bad trades come from a timeframe mismatch. A chart can look bullish on the 5-minute timeframe and still be moving straight into resistance on the 4-hour chart. That is not a minor detail. It changes the quality of the setup.
A practical approach is to use the higher timeframe to define context and the lower timeframe to refine entry. If the daily chart is making higher highs and higher lows, you have a trend framework. Then you can use the hourly or 15-minute chart to look for pullbacks, breakouts, or continuation patterns inside that larger move.
When timeframes conflict, caution usually pays. You do not need every timeframe to align perfectly, but trading directly against a strong higher-timeframe trend often lowers your margin for error. Countertrend setups can work, but they usually require tighter execution and faster profit-taking.
Indicators can help, but only if they stay in a supporting role
Moving averages, RSI, and MACD can all help you spot trend conditions faster. The mistake is treating them as decision-makers instead of tools.
Moving averages are useful because they smooth price and make direction easier to see. If price is trading above a rising moving average and repeatedly respecting it on pullbacks, trend conditions may be healthy. If price is chopping above and below a flat moving average, the market may lack direction.
Momentum indicators can help you judge whether a move has strength or is starting to weaken. But they can also trap traders who use them mechanically. An overbought RSI reading in a strong uptrend does not automatically mean short. Often it just means the trend is strong. Context matters more than any single reading.
The best use of indicators is confirmation. Let structure lead, let levels frame the setup, and let indicators add confidence or caution.
Speed matters, but discipline matters more
There is a reason active traders struggle with trend spotting even after they know the theory. Charts move fast. Bias changes fast. The more markets you scan, the harder it becomes to evaluate each setup consistently.
That is where process becomes an edge. Instead of staring at dozens of charts and second-guessing every pattern, reduce the workflow to a repeatable sequence. Check structure. Mark key levels. Compare timeframes. Review volume and momentum. Then decide whether trend conditions are clean, mixed, or weak.
If that sounds time-consuming, it is. Manual chart review creates friction, especially for traders scanning stocks, forex pairs, or crypto markets in real time. AI-powered chart analysis can help shorten that cycle by identifying trend direction, support and resistance, and actionable zones in seconds. For traders who want faster confirmation without skipping structure, tools like ChartViews AI fit naturally into that workflow.
The benefit is not replacing judgment. It is reducing hesitation and improving consistency. You still need to decide whether the setup fits your risk and timeframe.
The biggest mistakes traders make when spotting trends
The first mistake is confusing movement with trend. Fast price action attracts attention, but speed alone does not create direction. You need follow-through.
The second mistake is entering late because the chart finally looks safe. The cleaner a trend looks to the crowd, the more likely your reward-to-risk has already deteriorated. Often the better trade came on the pullback, retest, or early break of structure.
The third mistake is ignoring context. A bullish pattern at a major resistance level is not the same as a bullish pattern after a confirmed breakout. Location changes meaning.
The fourth mistake is trying to force certainty. Market trends are not fixed. They strengthen, pause, fake out, and reverse. Good traders do not need certainty. They need evidence, probabilities, and a defined invalidation point.
Build a trend-spotting routine you can actually trust
If you want better results, stop asking whether a chart looks good and start asking whether it meets your conditions. That subtle change improves discipline immediately.
A strong routine should tell you three things: the current direction, the nearest levels that matter, and what would prove your idea wrong. Once you have that, the chart becomes easier to trade because the decision is framed before emotion takes over.
You will still get false starts. Every trader does. But trend spotting gets better when your analysis is fast enough to keep up and structured enough to stay consistent. The edge is not seeing the future first. It is recognizing the shift before the market makes it obvious to everyone else.
The traders who improve fastest are rarely the ones hunting the most indicators. They are the ones who learn to read structure clearly, act when evidence lines up, and stay patient when it does not.
Educational content, not financial advice. Trading involves risk of loss.
 Money Circle Blog
 Trader Reflect Blog