AI in Technical Analysis for Faster Trades

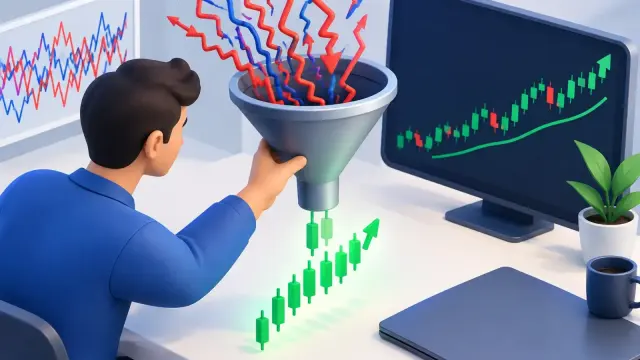
A chart can look clear after the move has happened. The harder job is reviewing it before entry, when price is compressing near resistance, momentum is mixed, and several timeframes appear to tell different stories. AI in technical analysis helps traders turn that review into a faster, more structured process - without pretending that a chart can predict the future.
For active traders, the value is not a magic buy or sell button. It is faster recognition of what matters: market trend, important price levels, momentum conditions, invalidation points, and the trade scenarios worth watching. Used well, AI reduces the time spent staring at charts and makes the reasoning behind a trade more consistent.
What AI in Technical Analysis Actually Does
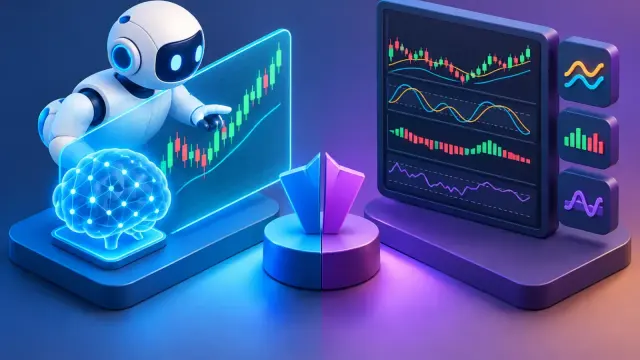
Technical analysis starts with price, volume, and market structure. Traders use those inputs to identify trends, support and resistance, chart patterns, volatility, and potential entry or exit zones. AI can process these signals quickly, recognize relationships between them, and present an organized read of the chart.
That matters when you are reviewing a watchlist of stocks before the opening bell, checking a crypto setup during a volatile session, or comparing forex pairs across multiple timeframes. Instead of manually rebuilding the same checklist on every chart, you can use AI to surface the key conditions in seconds.
A strong AI chart review may identify whether price is making higher highs and higher lows, consolidating in a range, or breaking down below a prior support zone. It can call attention to nearby resistance, moving-average alignment, trendline interactions, volume behavior, and potential areas where a setup is invalidated.
The output should be treated as structured decision support. It gives you a clearer starting point for evaluating a trade. It does not remove the need for position sizing, market context, or a plan for what happens if price moves against you.
Why Faster Chart Interpretation Matters
Missed trades are not always caused by a lack of knowledge. Often, they come from slow analysis, inconsistent routines, or too many charts competing for attention. A trader may recognize a breakout on one symbol but miss a cleaner setup elsewhere because the review process took too long.
AI improves efficiency by turning a visual chart into a concise assessment. That can help you move from “What am I looking at?” to “Is this a valid setup for my strategy?” much faster. The distinction is critical. Fast analysis only helps if it leads to disciplined filtering, not impulsive execution.
For newer traders, this structure can make technical concepts easier to apply. Support and resistance stop being vague lines drawn after the fact. Trend direction becomes a condition that can be checked. Entry, target, and stop areas become parts of a repeatable plan rather than last-minute guesses.
For experienced traders, the benefit is often confirmation and scale. You may already know how to read a chart. AI can help you review more opportunities, catch levels you want to revisit, and apply the same analytical standard when market conditions are moving quickly.
Where AI Adds the Most Value on a Chart
AI performs best when the task is defined. “Tell me what this chart means” is broad. “Identify the trend, key levels, and actionable scenarios on this 15-minute chart” produces a more useful framework.
Trend and market structure
Trend is the foundation of many trading decisions. AI can assess whether price action is trending upward, trending downward, or moving sideways. It can also identify structural shifts, such as a sequence of higher lows failing near resistance or a range breaking below support.
This does not mean every break becomes a trade. A breakout with weak follow-through, low volume, or major higher-timeframe resistance overhead may deserve caution. The AI read should help you see the condition, while your rules determine whether it qualifies.
Support, resistance, and trade location
Trade location matters as much as direction. Buying a strong stock directly into a well-defined resistance zone can create poor risk-reward, even if the larger trend is bullish. Shorting a weak chart into established support can create the same problem in reverse.
AI can highlight the levels where price previously reacted, stalled, reversed, or accelerated. These zones help traders define where an entry makes sense, where a target may sit, and where the original idea is no longer valid.
The most useful levels are not necessarily exact pennies. Markets often react within areas, especially on volatile stocks and crypto assets. Treat AI-detected support and resistance as zones to evaluate alongside current price behavior, liquidity, and your timeframe.
Entries, exits, and invalidation
An actionable analysis should separate a possible entry from a confirmed trigger. For example, price approaching support is an area of interest. A reversal candle, reclaim of a key level, volume expansion, or break of short-term structure may be the trigger that turns interest into a trade.
AI can help map these scenarios: bullish continuation above resistance, a pullback entry near support, or a bearish breakdown if a level fails. It can also identify an invalidation area, which is often more useful than an optimistic price target. Knowing where you are wrong protects capital and prevents a small trade from becoming an uncontrolled loss.
A Better Workflow for Using AI Analysis
The best workflow keeps the trader in control. Start with the market and timeframe that match your strategy. A day trader may focus on five-minute, 15-minute, and hourly charts. A swing trader may prioritize daily and four-hour structure. The same chart can produce very different conclusions depending on the holding period.
Next, provide a clean chart image with the symbol, timeframe, price action, and any indicators you rely on clearly visible. Ask for a specific analysis: trend direction, major support and resistance, likely scenarios, and potential entry, target, and invalidation zones.
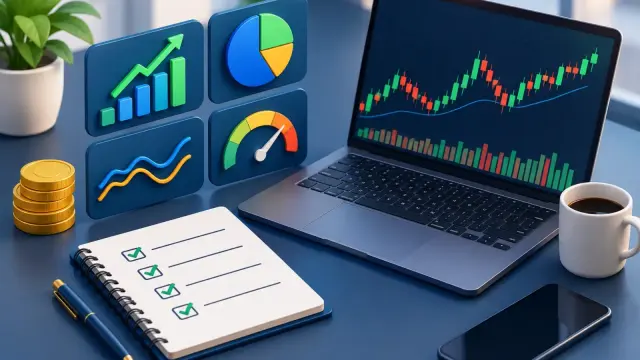
Then compare the AI response with your own checklist. Is the setup aligned with the broader trend? Is there enough room to the next level? Does the stop location fit your risk limit? Is a scheduled event, earnings release, central-bank decision, or high-impact economic report likely to change the trade’s character?
This final step is where discipline lives. A technically attractive chart may still be a pass if the risk-reward is weak, the market is choppy, or the position would be too large for your account. AI can accelerate the analysis. It cannot make a poor trade plan sound.
What AI Cannot See From the Chart Alone
A chart image contains valuable information, but it is not the full market. It may not reflect developing news, order-book dynamics, unusual options activity, broader sector rotation, or a catalyst that hits after the analysis is generated. It also cannot know your buying power, existing positions, tax situation, or tolerance for drawdown.
That is why blindly following AI-generated trade levels is a mistake. A level is not a guarantee of a reaction. Technical analysis works in probabilities, and those probabilities change with volatility, volume, liquidity, and market regime.
There is also a quality issue. Incomplete screenshots, unclear timeframes, distorted chart scales, and cluttered indicators can lead to weaker analysis. Better inputs produce better outputs. If the chart is difficult for you to read, it may be difficult for any analysis tool to interpret with precision.
Turn Analysis Into a Repeatable Edge
The strongest use of AI is not finding one perfect trade. It is building a repeatable process that helps you review more charts, define risk before entry, and avoid decisions driven by hesitation or emotion.
Use the same questions every time: What is the trend? Where are the key levels? What confirms the setup? Where is the trade invalidated? Is the potential reward worth the risk? Over time, this creates data you can review and improve.
ChartViews AI is built for that workflow. Upload a chart, receive instant AI-powered analysis, and use the identified trend, support, resistance, and potential trade levels to make your next review faster and more organized.
The chart will never eliminate uncertainty. Your advantage comes from recognizing the setup, defining the risk, and acting only when the trade meets your standard.
Educational content, not financial advice. Trading involves risk of loss.
 Money Circle Blog

 Trader Reflect Blog