7 Top Chart Analysis Mistakes That Cost Trades

A chart can look obvious after a move has already happened. Before the move, the same chart may contain conflicting signals, uneven liquidity, and levels that only matter if price confirms them. The top chart analysis mistakes usually do not come from missing an exotic pattern. They come from treating a probability tool as certainty and making decisions without a defined process.
For active traders, better chart reading is less about adding indicators and more about removing avoidable errors. Whether you trade stocks, forex, or crypto, these seven mistakes can damage trade timing, risk control, and consistency.
1. Trading Without Higher-Timeframe Context
A five-minute breakout can look strong until you zoom out and see it is pushing directly into daily resistance. A short setup may look clean on an intraday chart while the broader market is trending aggressively higher. The lower timeframe provides execution detail, but it does not replace context.
Start with the timeframe that reflects the holding period you intend to trade. A day trader may use the daily and hourly charts to establish directional context, then use the five- or fifteen-minute chart for entries. A swing trader may begin with the weekly and daily charts before narrowing down to the four-hour chart.
This does not mean every trade must align perfectly across every timeframe. Markets rarely offer that kind of clarity. It means you should know whether you are trading with the larger trend, attempting a pullback entry, or deliberately taking a countertrend setup. Each choice calls for different expectations and tighter or looser risk management.
2. Treating Support and Resistance as Exact Prices
Support and resistance are zones where buyers or sellers previously became active. They are not magic lines that price must respect to the cent. Yet traders often enter exactly at a drawn level, set a stop one tick beyond it, and assume a brief wick means their analysis was wrong.
Price often probes beyond an obvious level because liquidity tends to collect around visible highs, lows, and round numbers. A better approach is to mark a zone, then watch how price behaves within it. Does it reject quickly? Does volume increase? Does the level flip from resistance to support after a breakout? Is the market accepting prices beyond the zone?
The width of that zone depends on the asset, volatility, and timeframe. A narrow range in a liquid large-cap stock may justify a precise level. A volatile crypto pair or a higher-timeframe forex chart usually requires more room. Precision is valuable, but false precision is expensive.
3. Entering Before Price Confirms the Setup
Anticipation can produce excellent risk-to-reward trades, but it can also turn a planned setup into a premature guess. Traders see price approaching support, imagine the bounce, and enter before there is evidence that buyers have actually stepped in. The same problem appears when shorting resistance before momentum has slowed.
Confirmation is not one fixed signal. It may be a reclaim of a key level, a close above a breakout area, a higher low, a rejection candle, or momentum shifting in the expected direction. The trade-off is clear: waiting for confirmation can mean entering at a less favorable price. In return, you reduce the chance of buying a falling market or shorting one that is still accelerating upward.
Define the condition that turns your idea into a valid trade before you place it. “Price is near support” is an observation. “Price reclaims support and holds above it on the next candle” is a tradable condition.
4. Adding Indicators Until the Chart Says Nothing
Indicators can organize information, but too many of them create a delayed and contradictory picture. One tool signals momentum is rising, another says the market is overbought, and a third produces a crossover after the move is largely complete. The result is analysis paralysis rather than better analysis.
Build your chart around the information that directly supports your strategy: price structure, key levels, trend, volume when relevant, and a small number of indicators you understand. A moving average may help define trend direction. RSI may help identify momentum conditions. Neither replaces price action or a risk plan.
The question is not whether an indicator is good. The question is whether it changes a decision you can explain and repeat. If removing it would not change your entry, stop, target, or decision to stay out, it is probably adding noise.
5. Ignoring the Level That Invalidates the Trade
Many weak trades begin with a target and end with no clear answer to one basic question: where is the idea wrong? Without an invalidation level, traders tend to move stops, average down, or hold a losing position because they still “like the setup.” That is not disciplined chart analysis. It is hope replacing a plan.
Your invalidation should be based on market structure, not on the dollar amount you would prefer to lose. For a long trade, it may sit below a support zone or below the higher low that supports the bullish thesis. For a short trade, it may sit above resistance or above the swing high that defines the bearish structure.
Position size follows from that level. If a valid stop is wider than your risk limit allows, reduce size or pass on the trade. Tightening a stop solely to increase position size often places it inside normal market noise. A smaller position with a logical invalidation is usually the more professional choice.
6. Forgetting That Market Conditions Change
A breakout strategy can perform well in a trending market and struggle badly in a low-volume range. Mean-reversion entries can work inside balanced price action, then fail repeatedly when a strong catalyst drives a one-way move. The chart pattern may look similar while the underlying conditions are completely different.
Before acting, assess the environment. Is the market trending, ranging, or expanding after a period of compression? Is volume normal for the session? Is a major economic release, earnings report, or central bank decision likely to change volatility? Is the broader index or sector supporting the setup?
This is where traders often confuse consistency with rigidity. A consistent process does not mean taking every signal. It means applying the same filters and recognizing when conditions do not support your edge. No trade is a valid outcome when the market does not offer clear structure.
7. Reviewing Charts Only When You Want to Trade
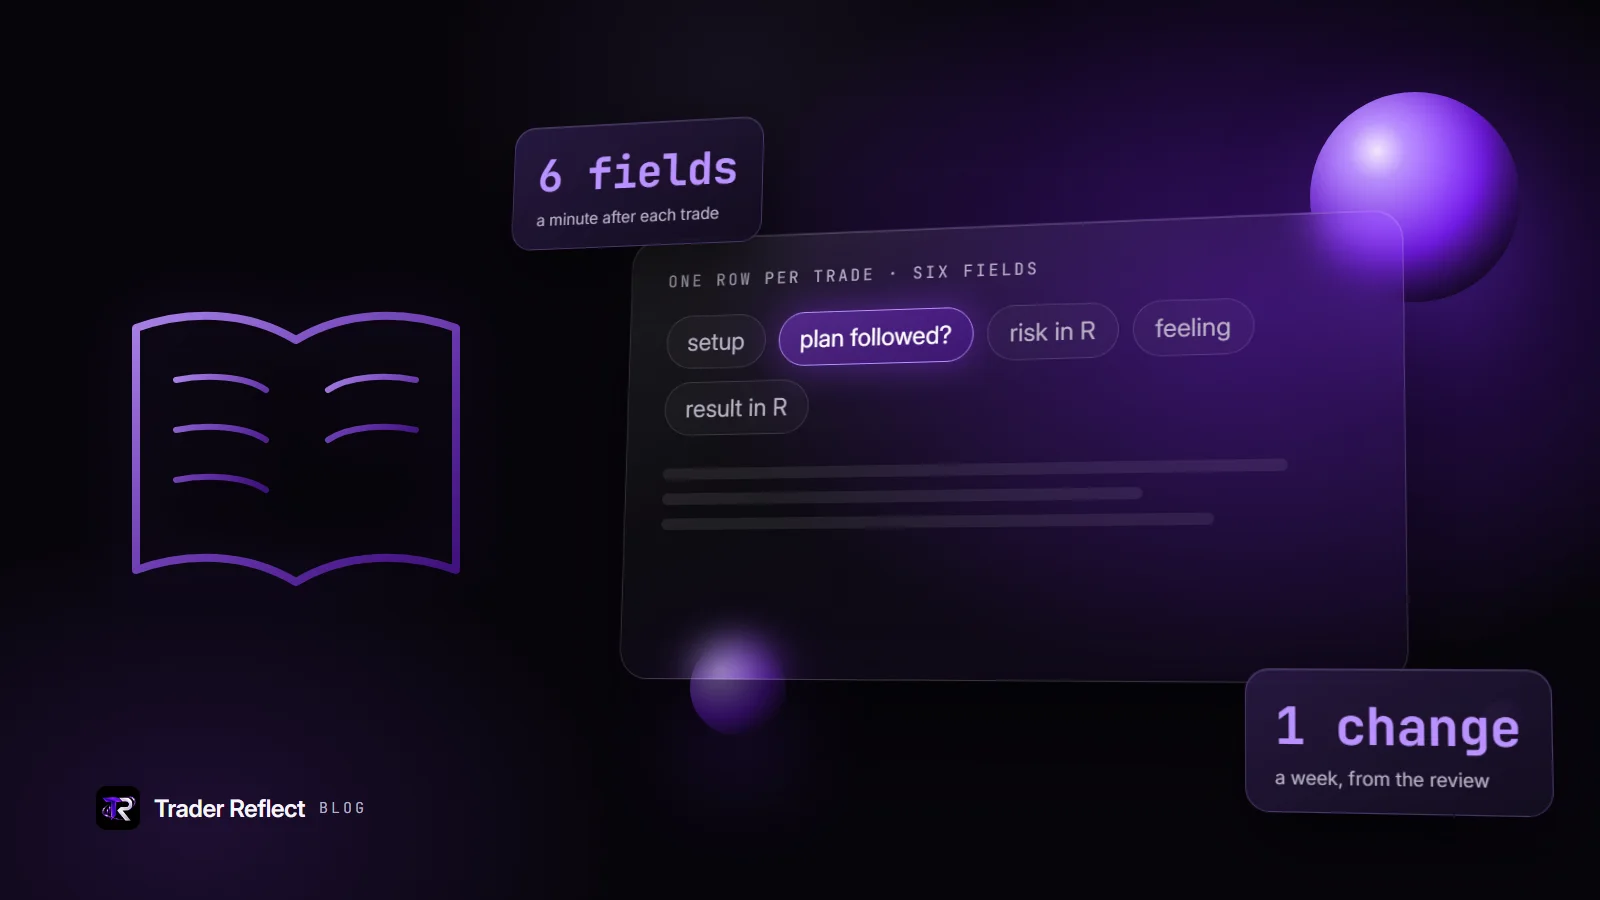
The fastest way to repeat a mistake is to never document it. If you only study charts while searching for the next entry, you will remember the wins emotionally and explain away the losses. A short post-trade review turns chart reading into a feedback loop.
Save the chart at entry and exit. Record the timeframe, market condition, planned entry, invalidation, target, and the reason for the trade. Then review whether the loss came from poor analysis, poor execution, or a setup that followed the plan but did not work. Those are different problems and require different fixes.
You do not need a complicated journal to benefit. A repeatable chart-review workflow is enough. Tools such as ChartViews AI can help traders quickly identify trend direction, support and resistance zones, and potential entry and exit areas from an uploaded chart, creating a structured second look before a decision is made. The final call, risk level, and execution rules should always remain yours.
Build a Better Chart Analysis Process
The most effective fix for chart mistakes is a pre-trade checklist that is short enough to use under pressure. Confirm the higher-timeframe context, identify the key zone, define the trigger, place the invalidation, and check whether the potential reward justifies the risk. If one element is unclear, wait.
That process will not eliminate losses. It will make losses more measurable, prevent random entries, and show you which parts of your strategy actually deserve confidence. The next time a chart appears obvious, slow down long enough to ask what would prove your idea wrong. That question often protects the trade before the market has to.
Educational content, not financial advice. Trading involves risk of loss.
 Money Circle Blog
 Trader Reflect Blog