Double Tops and Bull Flags on Gold: Confirmation, Invalidation, Ratio
In this article
Chart patterns have a reputation for being either magic or nonsense. They are neither. A pattern is a short description of how buyers and sellers behaved over a stretch of candles, and it comes with a plan: where the idea is proven wrong, and where a measured move might end. Two of the patterns traders ask about most are the double top and the bull flag, and gold (XAU/USD) is a market where both are easy to find.
This guide shows how to read each one on a gold chart, with hypothetical numbers, and how to check whether the pattern is a tradable idea or just a shape. It does not tell you which way gold will move, and it is educational, not advice.
A pattern is a plan, not a prediction
A pattern earns its place in your analysis only if it gives you three things before you enter: a condition that confirms it, a level that invalidates it, and a sensible target. If you cannot name all three, you are looking at a shape, not a setup.
For each pattern below we will name them, then check the ratio between risk and reward, because a clean-looking pattern can still offer a poor trade. Our guide to risk-reward ratio explains why that check matters.
The double top
A double top is two swing highs at about the same price, separated by a pullback, in a market that had been rising. It suggests buyers have twice failed to push beyond the same area. The pullback between the two highs creates a trough, and the line across that trough is the neckline.
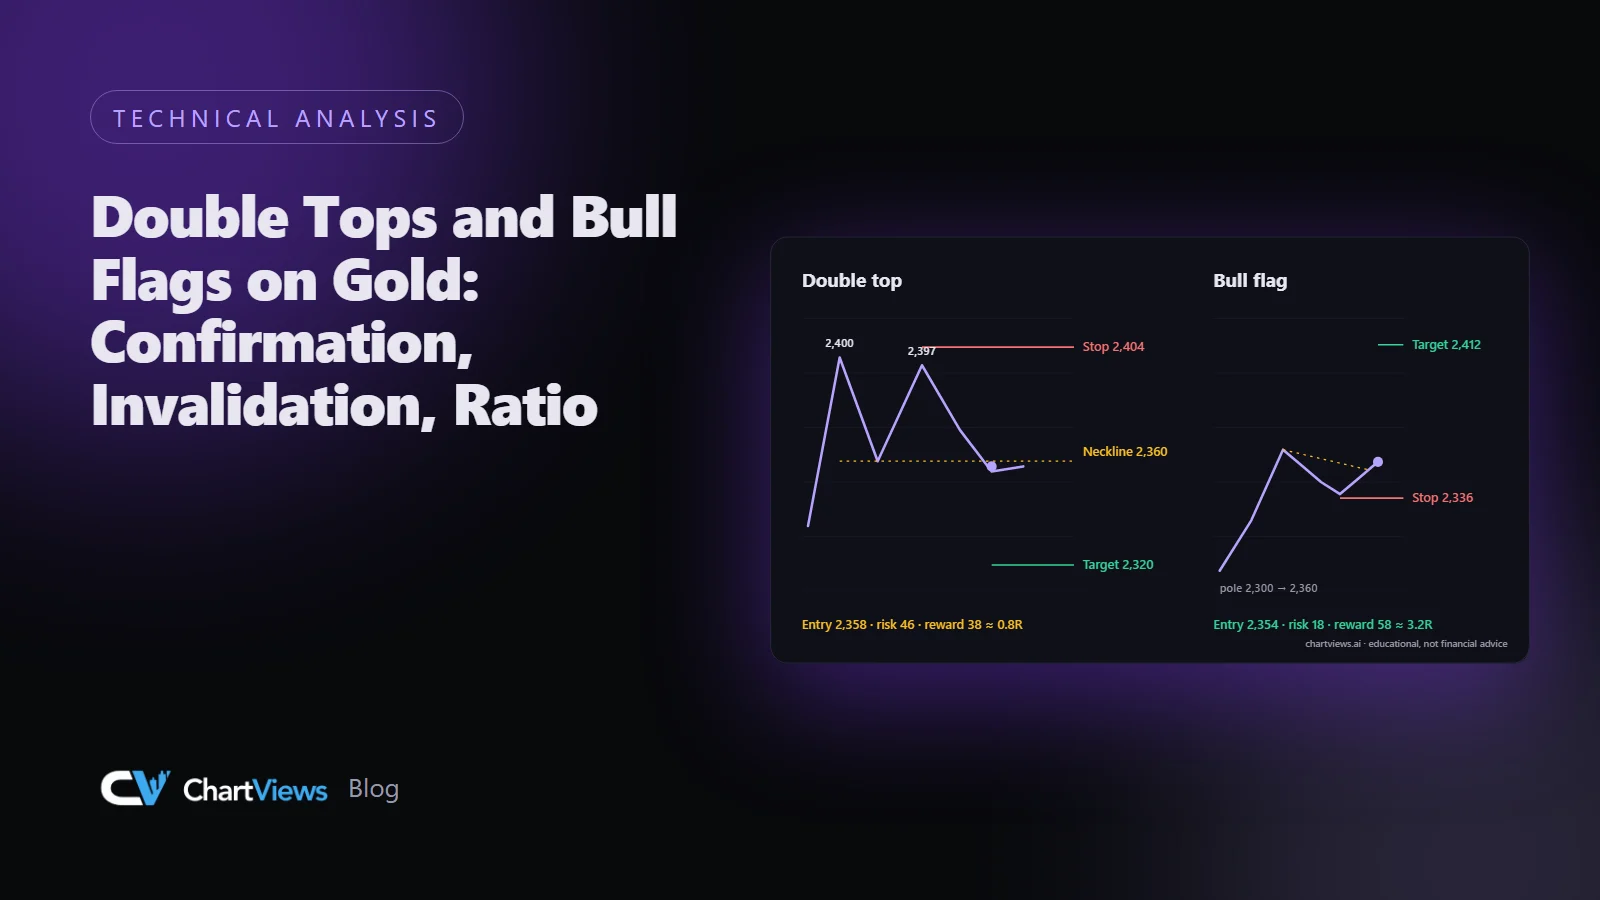
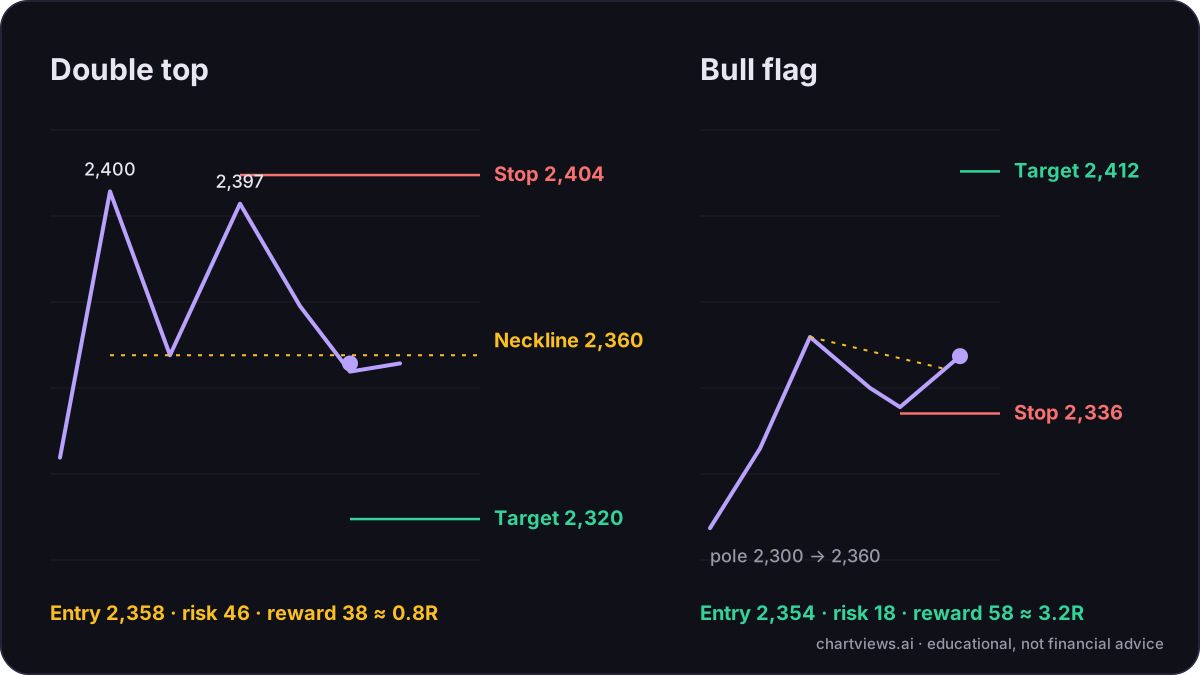
Suppose, hypothetically, gold rallies to 2,400, pulls back to 2,360, rallies again to 2,397 and turns down. The two highs are within a few units of each other, which is close enough to count. The neckline is at 2,360.
What confirms it
The pattern is not confirmed by the second high. It is confirmed when price closes below the neckline. Until then it is only a possible double top, and plenty of them turn into new highs. In the example, a daily close at 2,356 would confirm it.
What invalidates it
If price closes above the highs, the idea is wrong. A stop above the higher peak, plus a buffer, is the natural place: here 2,404.
The measured move and the ratio
A common way to estimate a target is to take the height of the pattern, from the highs to the neckline (2,400 minus 2,360, which is 40) and project it down from the neckline: 2,360 minus 40, which is 2,320.
Now check the arithmetic. If you enter at 2,358 after the close below the neckline, with the stop at 2,404, the risk is 46. The target at 2,320 gives a reward of 38. That is a reward smaller than the risk, about 0.8R. A textbook pattern, and still a trade many plans would reject. The honest answer might be to wait for a retest of the neckline, where the stop can be closer, or to skip it. The pattern did not become a good trade because it had a name.
The bull flag
A bull flag is a sharp rise (the pole), followed by a short, orderly pullback that drifts against the move in a narrow channel (the flag), followed by a breakout in the direction of the pole. It describes a pause in a strong move, not a reversal.
Suppose, hypothetically, gold climbs from 2,300 to 2,360 in a few sessions. That is the pole, 60 units tall. Over the next five candles it drifts down to 2,338 inside a channel whose upper edge runs from about 2,360 down to about 2,350. That is the flag.
What confirms it
A close above the upper edge of the flag. In the example, a candle that closes at 2,354, above the channel edge near 2,350, confirms it.
What invalidates it
A close below the low of the flag, since a deeper pullback means the pause has become something else. Put the stop just below the flag low: 2,336, two units under 2,338.
The measured move and the ratio
The pole height projected from the breakout gives a rough target: 2,352 plus 60 is 2,412. With entry at 2,354 and the stop at 2,336, the risk is 18 and the reward is 58, about 3.2R.
That looks attractive, and the lesson is not that flags are better than double tops. It is that this particular flag has a tight stop because the pullback was shallow, which is part of what makes it a good flag. A flag that retraces most of the pole is not a flag.
How to check a pattern before you trust it
A few checks apply to both patterns:
- Context. A double top means more after a clear advance. A bull flag needs a real pole before it. Without the preceding move, the shape means little.
- Size relative to normal movement. Compare the pattern to the usual daily range. A "pole" of 60 is only a strong move if it is large compared with typical days.
- Volume of candles, not volume of trades. Spot gold does not have a single central volume figure, so rely on candle size and character: strong candles in the pole, smaller overlapping candles in the flag.
- Higher-timeframe direction. A bull flag on the hourly chart inside a falling daily trend is a weaker idea than one that fits the larger picture.
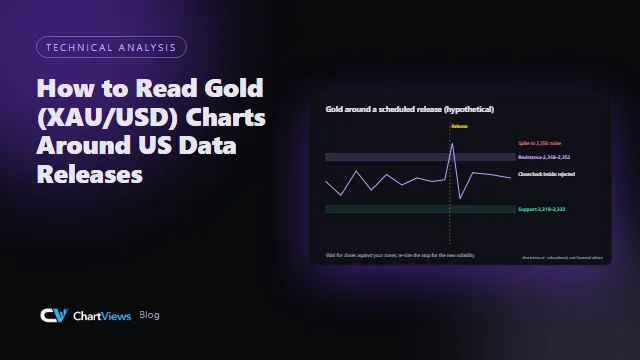
- Scheduled events. A release that lands in the middle of a pattern can destroy it. See our guide to reading gold around US data releases.
Common mistakes
- Calling it early. Waiting for the confirmation is the whole point. A double top that has not closed below the neckline is an observation.
- Ignoring the ratio. Check risk against reward for every pattern, as the double top example shows.
- Drawing patterns into noise. If you need to squint to see a flag, it is not there.
- Using the pattern name as a reason. "It is a double top" is not a reason for a trade. "It closed below the neckline and my stop is 46 away with a 38 target" is a plan you can test.
- Forgetting that patterns fail. Plan the loss as carefully as the gain.
Learn the shapes
You can read more about the structure of each pattern on our double top page and bull flag page, which describe the typical shape, the confirmation and the invalidation. For a worked look at one market, see the XAU/USD analysis page.
Using a second read
An AI chart analysis can point out candidate patterns, levels and scenarios on your gold chart, which you can compare with your own reading. It does not know what comes next, and it will not choose your stop or your size. Upload a chart to see what it highlights, and then do the confirmation, invalidation and ratio checks above yourself.
Want a structured second read of your own gold chart? Run an analysis on ChartViews AI.
Educational content, not financial advice. Trading involves risk of loss.
 Money Circle Blog
 Trader Reflect Blog