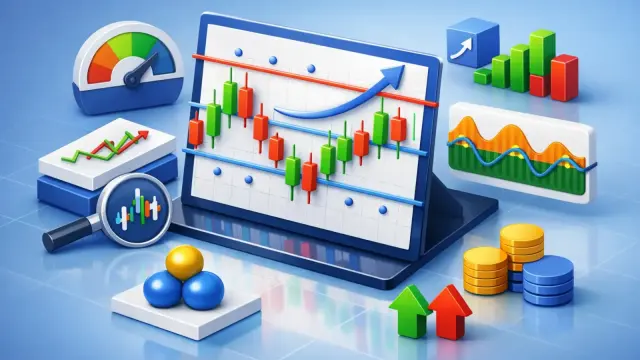
How to Automate Chart Annotations for Faster Trades

A clean chart can become crowded fast. After marking swing highs, support zones, trendlines, breakouts, targets, and invalidation levels across several markets, the analysis work can take longer than the trade decision itself. When you automate chart annotations, you reduce that manual workload and create a more consistent process for reviewing every setup.
For active traders, the value is not adding more lines to a chart. It is seeing the levels that matter, understanding the market structure around them, and deciding whether a setup meets your criteria. Automation helps get you there faster - provided you treat it as decision support, not an autopilot.
Why automate chart annotations?
Manual annotation has a hidden cost: inconsistency. You may draw a support area as a narrow line on one chart, then treat a similar reaction zone as a wide range on the next. During a fast market session, it is also easy to overlook a prior high, ignore a nearby resistance area, or anchor a trade plan to a level that no longer matters.
Automated annotations apply the same analytical framework each time. A system can detect visible trend direction, identify potential support and resistance, recognize key price reactions, and surface likely entry, target, and risk levels. That creates a faster first read of the chart and gives you a structured place to begin.
This is especially useful when you review multiple assets. A forex trader watching several major pairs, a crypto trader scanning momentum moves, or a stock trader checking premarket charts faces the same problem: attention is limited. Automating repetitive chart review preserves more of that attention for context, timing, and risk management.
The trade-off is straightforward. Automated analysis can identify technically relevant areas, but it cannot know your full trading plan, account risk, news exposure, or tolerance for volatility unless you supply that context. The annotations should sharpen your judgment, not replace it.
What annotations should be automated?
The best annotations are the ones that are repeatable, visually meaningful, and tied to a trading decision. Start with the structure that tells you where price has reacted and where it may react again.
Support and resistance zones
Support and resistance are among the highest-value chart annotations because they frame potential decision points. An automated review can identify areas where price repeatedly stalled, reversed, consolidated, or accelerated after a breakout.
Treat these as zones rather than magic prices. In liquid, fast-moving markets, price may briefly move through a level before confirming a rejection or breakout. The question is not whether price touches a line exactly. The question is whether market behavior around that zone supports your trade idea.
Trend direction and structure
Trend labels help establish whether you are looking for continuation or reversal opportunities. Higher highs and higher lows can support a bullish structure, while lower highs and lower lows may point to bearish control.
This is where automation can prevent a common mistake: taking a countertrend setup without recognizing how much momentum sits behind the prevailing move. A label alone is not enough, but it forces the right question: is this trade aligned with structure, or does it need stronger confirmation?
Breakout and retest areas
Breakouts attract attention, but many fail when price cannot hold beyond the prior range. Automated chart annotations can flag range boundaries, breakout levels, and possible retest zones so you can distinguish between a clean expansion and a weak push into resistance.
For breakout traders, the retest is often more useful than the initial move. It can offer a clearer invalidation point and prevent chasing price after momentum has already extended.
Entry, target, and invalidation levels
A chart review becomes actionable when it translates analysis into a plan. Potential entries, profit targets, and invalidation levels make the risk-reward relationship visible before you place a trade.
These levels should never be accepted blindly. Adjust them to your timeframe, position size, preferred confirmation, and market conditions. A scalp on a five-minute chart requires a different structure than a swing trade built from the daily chart.
A practical workflow for automated chart review
Automation works best when it fits inside a disciplined process. The goal is not to upload a chart, read a label, and place an order. The goal is to reduce the time between seeing a chart and forming a clear, risk-defined trading thesis.
Begin with a chart that shows enough context. Include the ticker or trading pair, timeframe, price scale, and recent price action. If your screenshot is overly zoomed in, an analysis tool may identify a local level without showing the larger support or resistance area that controls the setup.
Next, use the automated output to answer three questions. What is the current trend or structure? Where are the nearest decision zones? What would prove the idea wrong? Those answers are more useful than a long list of indicators because they connect directly to trade selection and risk control.
Then compare the annotations with your own read. If the system identifies resistance directly above your proposed long entry, ask whether there is enough room for the trade. If it flags a bearish structure while you see a bullish reversal, look for the evidence that would justify going against the broader move. This comparison is where automation becomes a quality-control layer instead of a shortcut.
Finally, define the trade in plain language before acting. For example: price is holding above a prior breakout zone, the next resistance is far enough away to support the target, and the stop belongs below the retest low. If you cannot state the logic clearly, the chart is probably not ready for execution.
Use automation without creating false confidence
More annotations do not automatically mean better analysis. A chart covered in labels can create the appearance of precision while making the actual decision harder. Focus on the few areas that affect your entry, stop, target, and trade direction.
Timeframe alignment also matters. A bullish five-minute pattern can form directly beneath daily resistance. Neither view is necessarily wrong, but they imply different expectations. Short-term traders may still take the setup with tight risk, while swing traders may wait for a higher-timeframe breakout. Automated annotation is most useful when you know which timeframe drives your trade.
Market conditions change the meaning of levels as well. During major economic releases, earnings announcements, or sudden crypto volatility, support and resistance can break more easily than usual. In those conditions, use annotations to map risk, not to assume a predictable reaction.
It also pays to avoid confirmation bias. If an automated analysis agrees with your planned trade, do not stop there. Check the nearest opposing level, the quality of volume or momentum if relevant to your strategy, and whether the potential reward still justifies the risk. Good tools should make you more selective, not more impulsive.
Build repeatability into every chart review
The real advantage of chart automation is consistency at speed. Instead of starting from a blank screen each time, you begin with an organized view of trend, key levels, and possible trade structure. That can reduce analysis paralysis for newer traders and cut review time for experienced traders managing multiple setups.
ChartViews AI is designed for this workflow: upload a trading chart, receive instant AI-powered analysis, and use the identified trend, support and resistance levels, and potential trade areas to structure your next decision. The final call remains yours, but the manual annotation burden does not have to be.
The strongest trading process is rarely the most complicated one. Use automated chart annotations to see the market structure faster, then let disciplined confirmation and defined risk determine whether the trade deserves your capital.
Educational content, not financial advice. Trading involves risk of loss.
 Money Circle Blog

 Trader Reflect Blog