AI Chart Scanner Versus Indicators: What Wins?
A clean chart can still create a slow decision. You may have RSI, moving averages, VWAP, and Fibonacci levels on screen, yet still spend ten minutes asking the same questions: Is the trend intact? Where is the real support? Is this pullback an entry or a warning?
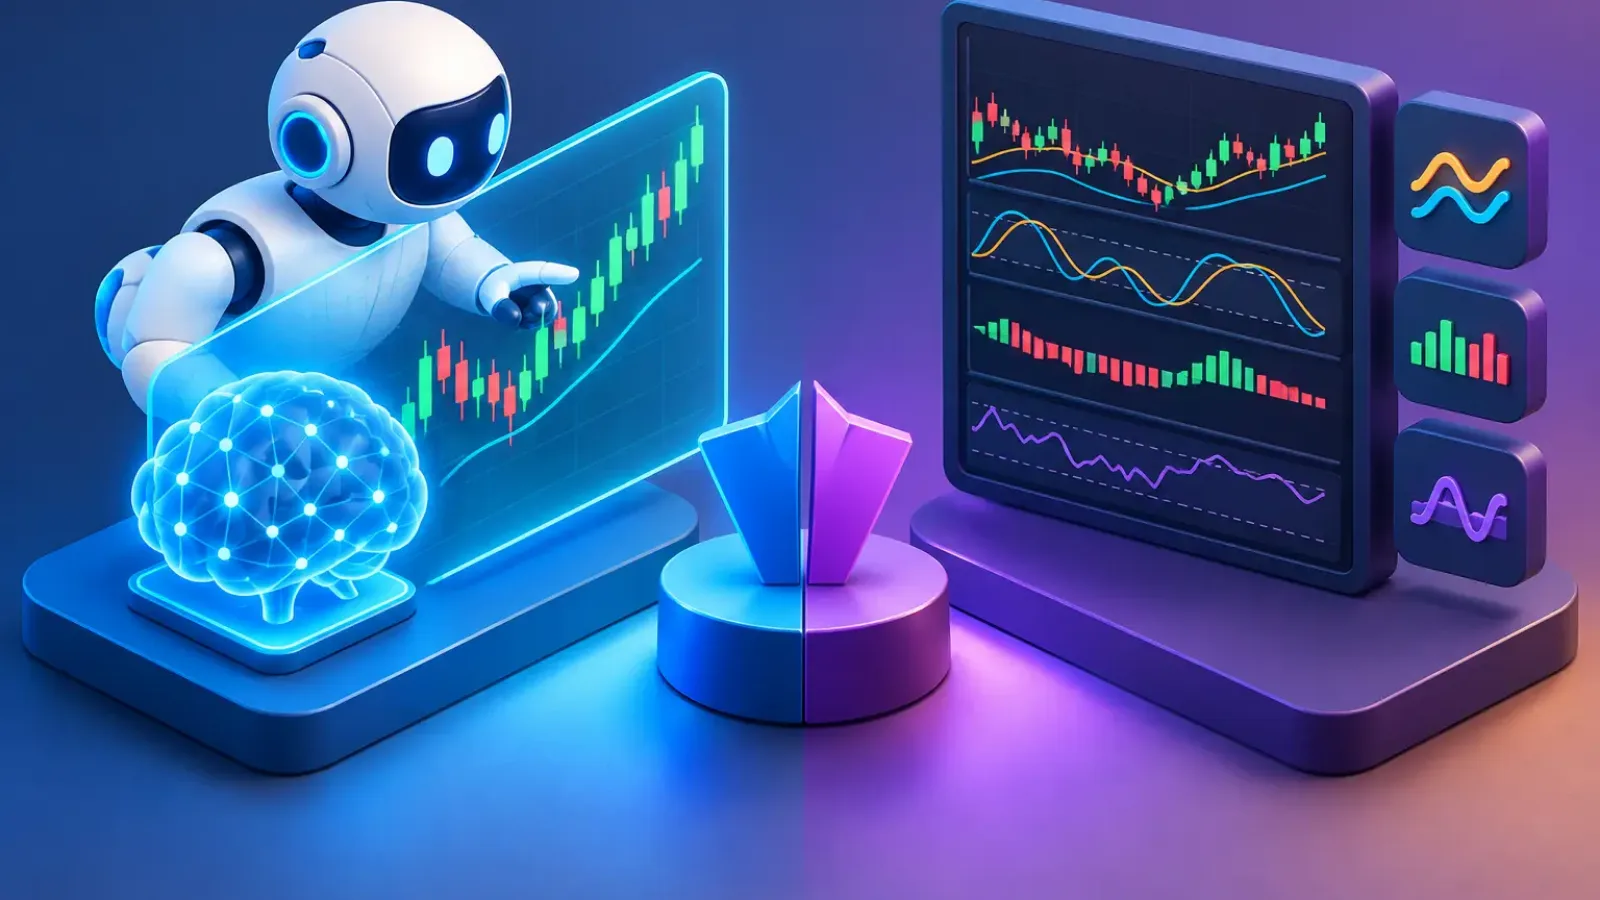
The AI chart scanner versus indicators debate is not about choosing the newest tool over the oldest. It is about deciding how you want to process market information. Indicators calculate one defined input. An AI chart scanner can review the visual structure of the chart, organize the relevant signals, and help turn a crowded setup into a clearer trading plan.
For active traders reviewing stocks, forex, crypto, or indices, the best answer is usually not either-or. It is knowing what each approach does well, where it can fail, and how to use both without handing over your judgment.
AI chart scanner versus indicators: the core difference
Technical indicators are formulas. They transform price, volume, or time data into a visual reading. A 20-period moving average tracks average price. RSI measures the speed and magnitude of recent price changes. MACD compares moving averages to signal momentum shifts. Their strength is consistency: given the same inputs and settings, they produce the same output every time.
An AI chart scanner works from a broader visual and structural perspective. It can assess price action, trend direction, support and resistance zones, chart patterns, and potential entry and exit areas from the chart image itself. Rather than forcing you to interpret several separate readings, it aims to present the chart's most relevant structure in one organized analysis.
That difference matters when the chart is ambiguous. An RSI reading below 30 may flag oversold conditions, but it cannot tell you on its own whether price is falling into a major weekly support zone, breaking down through it, or beginning a reversal. Context changes the meaning of the signal.
Indicators measure. A chart scanner interprets structure. Neither creates certainty, but they reduce different types of uncertainty.
Where indicators still earn their place
Indicators remain useful because they are fast, transparent, and easy to test. A trader using a defined strategy may need a simple condition such as price above the 200-day moving average, RSI crossing above 50, or volume exceeding its recent average. Those rules can help remove emotion from execution.
They also work well when you already know what you are looking for. If your plan is to trade pullbacks in a strong uptrend, a moving average can quickly show whether price has returned to your preferred area. If you trade momentum breakouts, volume and ATR can help you judge participation and realistic risk distance.
The limitation is that indicators are often lagging or isolated. They confirm what has already happened, and many traders stack them until the chart becomes a collection of repetitive signals. RSI, stochastic, and MACD may all be telling a similar momentum story. More indicators do not automatically mean more confirmation.
A stronger workflow asks a simpler question: what information does this indicator add that price structure has not already shown? If the answer is unclear, it may be adding noise rather than edge.
The indicator trap: false precision
Indicator values can look objective, which makes them easy to overtrust. But settings are choices. A 14-period RSI is not a market law. A 50-day moving average may matter on one asset and timeframe while carrying little weight on another.
The bigger problem is treating a single trigger as a trade thesis. A bullish crossover at resistance is not the same setup as a bullish crossover after a successful retest of support. The formula may be identical. The risk profile is not.
Where an AI chart scanner has the advantage
An AI chart scanner is especially useful when speed and consistency are the bottleneck. Traders rarely struggle because they cannot add an indicator. They struggle because they have too many charts, too little time, and no repeatable way to prioritize what matters on each one.
By analyzing a chart upload, an AI-driven tool can identify the current trend, key support and resistance levels, potential breakout or breakdown areas, and possible entry and exit zones. That gives the trader a structured starting point without manually redrawing every level or trying to classify every pattern from scratch.
This is valuable in three common situations. First, during a broad market scan, when you need to review many possible setups before the opportunity has passed. Second, when a chart has conflicting signals and you need an independent structural read. Third, when you are developing your chart-reading skill and want a disciplined framework for reviewing your own conclusions.
ChartViews AI is built around that workflow: upload a chart, receive instant AI-powered analysis, then use the resulting trend and level map to make a more informed decision.
The key benefit is not that AI should place the trade for you. The benefit is that it can compress chart review time and make the same core questions easier to answer: What is price doing? Where are the decision levels? What would invalidate the idea? Where does the reward justify the risk?
The trade-offs traders should understand
AI chart analysis is not a substitute for market context. A chart image may not fully capture upcoming earnings, economic data, liquidity conditions, correlation risk, or a news-driven volatility event. If you trade equities, a technically clean setup can fail when earnings are due the next morning. If you trade crypto, a support level can become irrelevant during a sudden liquidation cascade.
There is also a quality issue with the input. A blurry screenshot, an unusual scale, or a chart filled with drawings can make any visual analysis less reliable. Use clean charts, show enough price history to establish context, and select the timeframe that matches your holding period.
Indicators have trade-offs too. They can create delayed entries, false signals in choppy conditions, and confidence that is not supported by price action. The risk is different, but the discipline requirement is the same: every tool needs a defined role.
An AI scanner is strongest as a decision-support layer. Indicators are strongest as specific measurements and rule-based filters. Neither should be treated as a prediction machine.
A faster workflow that uses both
Start with structure, not signal hunting. Review the higher timeframe first and determine whether price is trending, ranging, or transitioning. Identify the nearest meaningful support and resistance zones. Then decide whether the setup offers enough room to your target before price reaches the next obstacle.
Use an AI chart scanner at this stage to create a fast, consistent chart read. Compare its view with your own. If it identifies a key level you missed, investigate it. If it disagrees with you, do not assume either side is automatically right. Use the difference to check your assumptions.
Next, apply only the indicators that support your strategy. A trend trader may use moving averages and volume. A mean-reversion trader may prioritize RSI alongside established range boundaries. A day trader may focus on VWAP, relative volume, and intraday support and resistance. Keep the indicator set narrow enough that each signal has a job.
Finally, turn the analysis into a plan before entering. Define the entry trigger, stop location, target area, and the condition that tells you to stay out. If the chart cannot support those decisions, the right action may be no trade.
Example: a pullback that looks better with context
Imagine a stock that has climbed steadily for several weeks. It pulls back to its 20-day moving average, and RSI falls toward 40. An indicator-only approach might call that a buy-the-dip signal.
A structural review may reveal that the moving average sits just below a prior breakout level, creating a stronger confluence zone. Or it may show that price is pulling back directly into a major resistance area that has not yet been reclaimed. Those are very different trades.
The scanner helps identify the price map. The indicators help time and filter the idea. Your risk rules decide whether it is worth taking.
Choose the tool based on the decision you need to make
If you need a precise, repeatable calculation, use an indicator. If you need to quickly understand trend, levels, and overall chart structure, use an AI chart scanner. If you need a complete trade decision, use both, then apply risk management and market awareness.
The traders who improve fastest are not the ones collecting the most signals. They are the ones building a process they can repeat under pressure. Let tools reduce the time spent staring at charts, but keep the final decision anchored to a clear setup, defined risk, and disciplined execution.
Educational content, not financial advice. Trading involves risk of loss.
 Money Circle Blog
 Trader Reflect Blog