How to Read Candlestick Wicks: Rejection, Levels and Stops
In this article
Beginners learn to read the body of a candle first: green or red, big or small. The thin lines above and below the body, the wicks, get less attention, and yet they record something the body cannot: how far price went and was pushed back. A long wick is a trace of a fight that one side lost. Reading wicks well can help you judge a level, a stop and a trade, and reading them badly is one of the quickest ways to see patterns that are not there.
This guide explains what wicks show, how to tell a meaningful wick from a random one, and how to use them around a level on a forex chart. The examples use EUR/USD with hypothetical prices. It is educational, not advice, and says nothing about where the pair will trade next.
What a wick is
Every candle has four prices: open, high, low and close. The body runs between the open and the close. The wicks, also called shadows or tails, run from the body to the high and the low.
- Upper wick: how far price rose above the body before it was pushed back down.
- Lower wick: how far price fell below the body before it was pushed back up.
A long upper wick tells you that buyers pushed price up and could not hold it, at least until the candle closed. A long lower wick tells you that sellers pushed price down and could not hold it. Wicks are about rejection of a price, within one candle's time.
That last point matters. A wick on a one-minute candle records rejection over one minute. A wick on a daily candle records a whole day of trading, which is why higher-timeframe wicks usually carry more weight than lower-timeframe ones.
Wicks only mean something at a place
A wick on its own is just a candle shape. The same shape can be important or meaningless, and the difference is location. A long upper wick that appears right at a resistance zone that has already rejected price twice is information. The same wick in the middle of nowhere, with no level near, is noise.
So before you read a wick, mark the levels first. Our guides to support and resistance levels that matter and how to find support and resistance fast show how. Then look at what the candles do when they reach those zones.
Three hypothetical candles
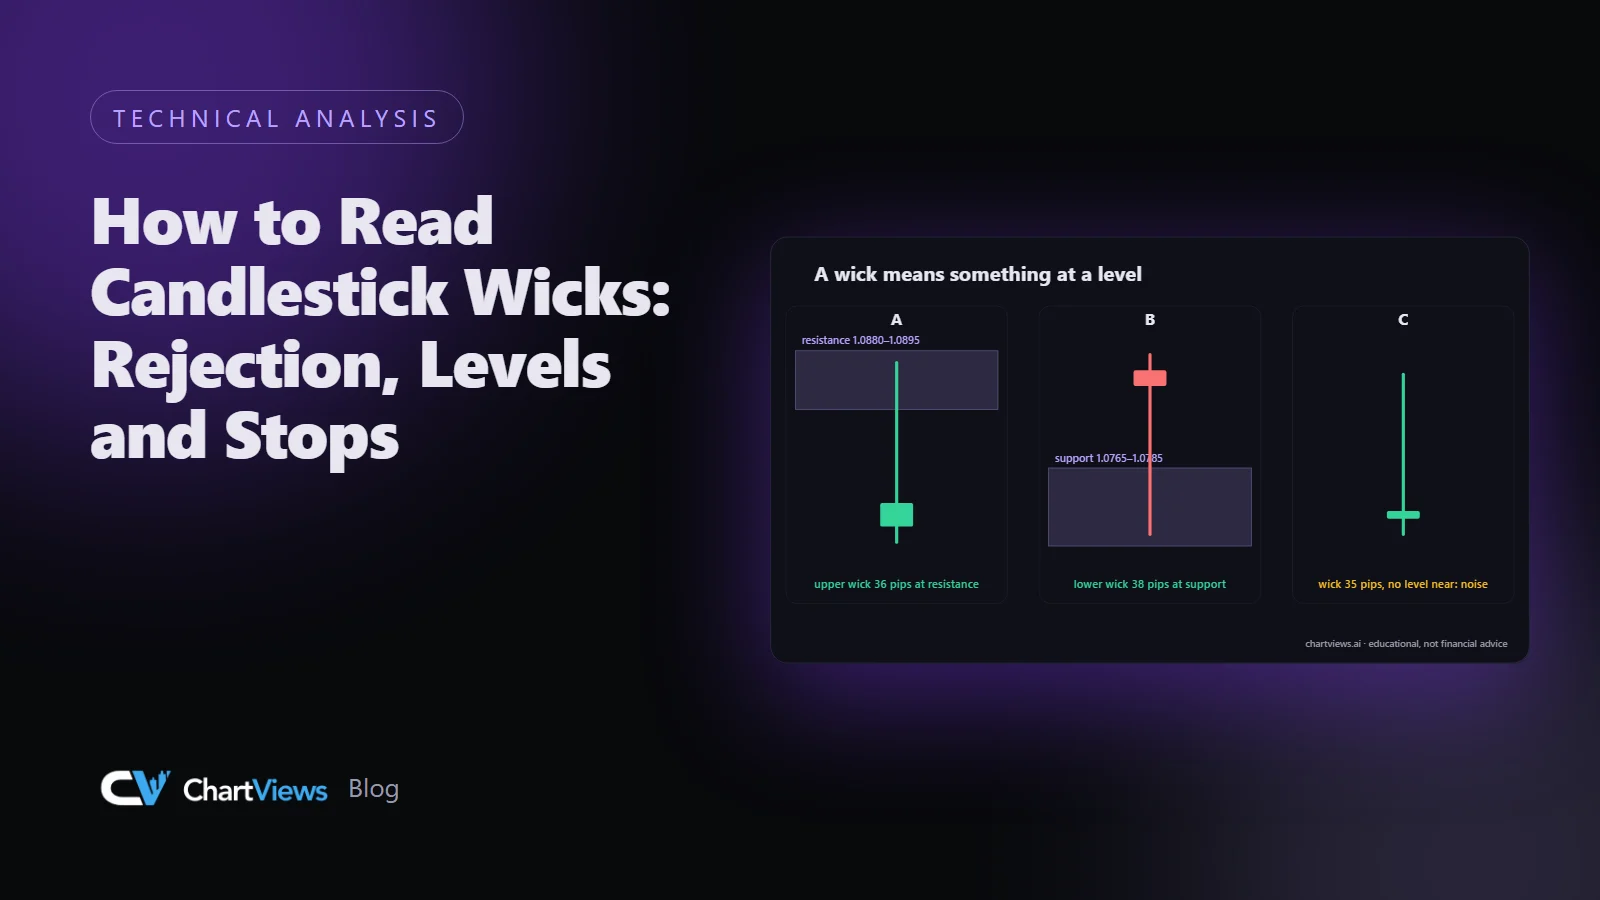
The figure below shows three candles on a hypothetical EUR/USD chart. The prices are invented.
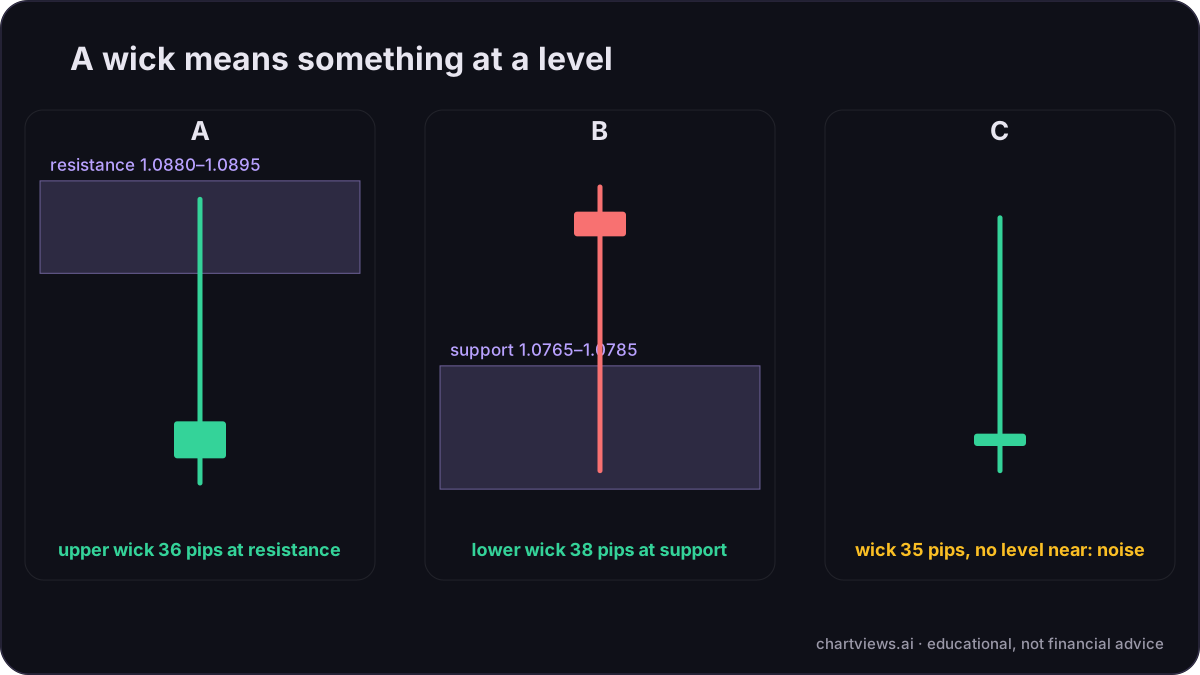
Candle A opens at 1.0850, spikes to 1.0892 and closes at 1.0856. The body is 6 pips and the upper wick is 36 pips, a wick six times as long as the body. It reaches into a resistance zone between 1.0880 and 1.0895 that has turned price back before. This is the textbook rejection.
Candle B opens at 1.0810, dips to 1.0768 and closes at 1.0806. The lower wick is 38 pips and the body is only 4 pips. It reaches into a support zone between 1.0765 and 1.0785. That is a rejection of lower prices at a place where buyers have appeared before.
Candle C has a wick of about 35 pips, but it sits in the middle of a range, far from any marked level. It opens at 1.0830, reaches 1.0867, drops to 1.0826 and closes at 1.0832. It looks as dramatic as the others, and it tells you almost nothing.
What a good rejection wick looks like
A wick is more convincing when several of these are true:
- It is long compared with the body. A wick much longer than the body means the candle spent most of its range being rejected.
- It sits at a level you marked before the candle formed. If you draw the level after the wick, you are fitting.
- It closes away from the extreme. The close should be back near the open, not at the end of the wick.
- It is on a timeframe that matches your plan. Rejections on the daily chart matter to a swing trader, and less to a scalper.
- It repeats. Several wicks into the same zone show a pattern, and one wick shows an event.
- The next candle agrees. A rejection wick followed by a candle that closes beyond it has been contradicted, not confirmed.
What a wick does not tell you
Wicks do not tell you what happens next. A rejection can fail. Price can come back to the same level a day later and push through. They also do not tell you the cause. A wick at a scheduled data release may reflect a one-minute spike in spreads and thin liquidity, not a battle between buyers and sellers. When a long wick appears at an event time, read it with care, and see our guide on what causes false breakouts.
Using wicks to place a stop
Wicks are useful for one practical job: deciding where a stop should not go. If price has wicked 38 pips below a body into a support zone, a stop 10 pips under the body sits inside the range of ordinary wicks and is easy to hit. A stop beyond the low of the rejection wick, with a buffer, is exposed only if price goes further than the market has already shown it is willing to go.
With candle B in the example, the low is 1.0768. A stop below it, say at 1.0758, gives 10 pips of buffer beyond the wick. If you were considering a trade from the support zone, the distance from an entry near 1.0810 to that stop is 52 pips. That is wide, and the position must be small to keep the risk to your plan. If the distance is too wide for your plan, the right answer is to skip the trade, not to move the stop inside the wick. Our guide to how to set a stop loss goes through the choices, and the position size calculator converts a stop distance into a size.
Common mistakes
- Reading every wick as a signal. Most wicks are noise. Only those at pre-marked levels count.
- Ignoring the timeframe. A wick on a five-minute chart is a weak reason to hold a swing trade.
- Entering on the wick itself. The wick is information about a candle that has already closed. Waiting for the close is not optional.
- Forgetting spreads. On a lower timeframe, a wider spread at the open or a release can create wicks that do not reflect real prices you could have traded at.
- Forgetting the whole picture. A rejection wick against a strong trend is a pause more often than a turn.
A short checklist
Before acting on a wick, ask:
- Is there a level I marked before the candle formed?
- Is the wick clearly longer than the body?
- Did the candle close back away from the extreme?
- Is the timeframe the one my plan uses?
- Was a scheduled release involved?
- Where would the idea be wrong, and what is the stop distance?
If the answer to the first question is no, move on.
Using a second read
If you would like a structured view of the levels around a chart before you look at the candles, upload it to ChartViews AI. The report maps trend, support and resistance and possible scenarios, and you can then check which of your wicks occur at those areas. It does not predict the next candle, and decisions, stops and size stay with you. You can read how the sections work in our guide to how to read an AI chart analysis report, and see the market page for EUR/USD.
Want a structured second read of your own forex chart? Run an analysis on ChartViews AI.
Educational content, not financial advice. Trading involves risk of loss.
 Money Circle Blog
 Trader Reflect Blog